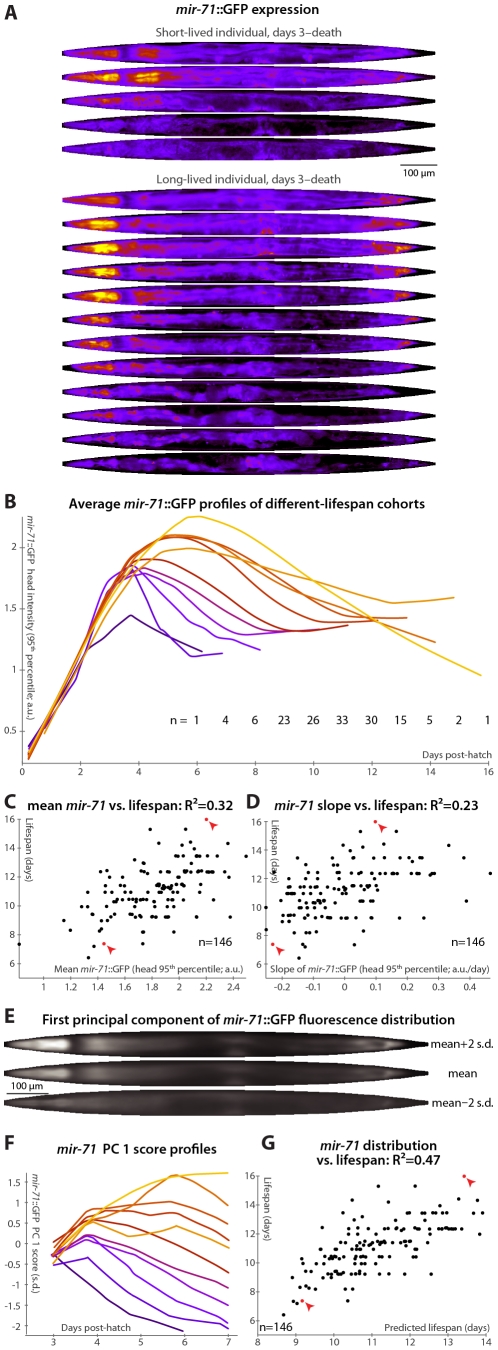
Figure 3. mir-71::GFP levels and expression patterns predict longevity.
(A) Daily images of mir-71::GFP expression patterns for two individuals, from day 3 to the last day of life are shown (top–bottom), straightened and pseudocolored as in Figure 2A. (B) Average mir-71::GFP expression (measured as the 95th percentile of head-region intensity) versus time is shown for cohorts with different longevities. Shorter-lived animals have, in general, lower and more rapidly declining levels of mir-71::GFP expression. (C,D) The mean of (C) and slope of a fit line to (D) days 3–7 mir-71::GFP expression correlates with each animal's future longevity. Regressing both jointly against longevity yields an R2 of 0.35 (p<10−13; l.o.o. 0.32). (E) The mean of 979 warped and aligned images of mir-71::GFP expression is shown, along with synthetic images illustrating two-standard-deviation offsets from that mean along the first principle component (PC1; the set of correlated changes in pixel intensities that together explain the maximal variance in the data set). In this case, PC1 spans 18% of the variability in the image data. This component reflects changes in the tissue-specificity of mir-71::GFP expression. An image can be scored in terms of standard deviations from the mean along this component (PC score); more positive scores indicate head/vulva/tail specificity and more negative scores indicate diffuse background expression. (F) Trends in PC scores (calculated only between days 3 and 7) are shown for the different-longevity cohorts in panel B. Higher scores and slowly falling scores are clearly associated with longer life. (G) The mean and fit slope of the PC scores of days 3–7 mir-71::GFP expression jointly predict future longevity; R2 = 0.47 (p<10−19; l.o.o. 0.45). The use of this prediction as a test for actual above-average longevity (including sensitivity and specificity figures) is shown in Figure S2D.

