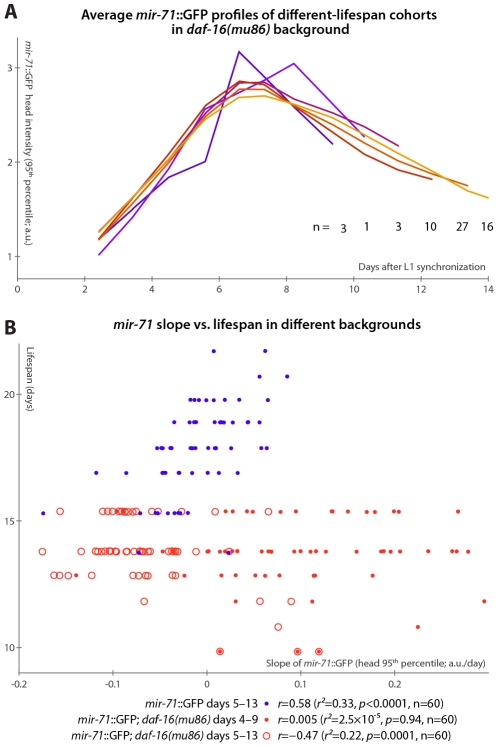
Figure 4. mir-71::GFP levels do not positively correlate with longevity absent DAF-16.
(A) Average mir-71::GFP expression (measured as the 95th percentile of head-region intensity) versus time is shown for cohorts of mir-71::GFP; daf-16(mu86) animals with different longevities. In contrast to Figure 3B, without DAF-16, longer-lived cohorts are not clearly distinct from shorter-lived cohorts in terms of temporal trends in mir-71::GFP expression. (B) The relationship between the slope of mir-71::GFP expression in the head in a defined time window and ultimate lifespan is shown for various strains and time windows. Blue circles mark mir-71::GFP animals, measured days 5–13 (which corresponds to the day 3–7 window after adjusting for the different lifespan induced by the culture conditions; see Materials and Methods and Figure S5A). Closed red circles mark mir-71::GFP; daf-16(mu86) animals measured days 4–9 (an adjustment accounting for the shortened lifespan of the strain), while open red circles mark the same strain measured days 5–15. In all cases, the reported correlation values do not strongly depend on the starting day.

