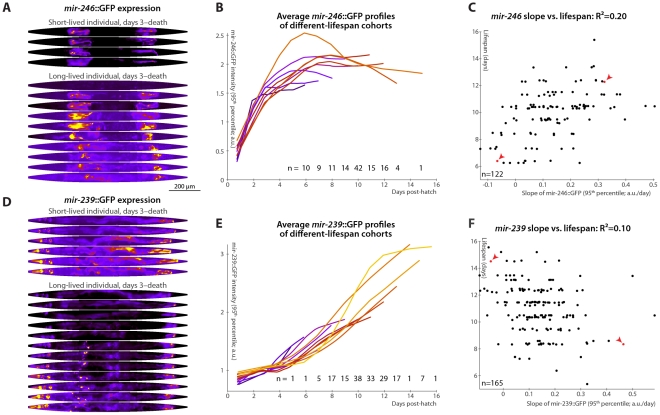
Figure 5. Changes in mir-246::GFP and mir-239::GFP expression over time predict longevity.
(A,D) Daily images of mir-246::GFP (A) or mir-239::GFP (D) expression patterns for two individuals, from day 3 to the last day of life are shown (top-to-bottom), straightened and pseudocolored as in Figure 2A. (B,E) Average mir-246::GFP (B) or mir-239::GFP (E) expression (measured as the 95th percentile of whole-body intensity) versus time is shown for cohorts with different longevities. Shorter-lived animals have, in general, more rapidly declining levels of mir-246::GFP expression and slightly more rapidly increasing levels of mir-239::GFP. (C) The slope of a fit line to mir-246::GFP intensity between days 3 and 7 correlates with each animal's future longevity; R2 = 0.20 (p<10−6; l.o.o. 0.18). Points corresponding to the individuals shown in panel A are in red and marked with arrowheads. (F) The slope of mir-239::GFP, days 3–7, anti-correlates with future longevity; R2 = 0.10 (p<10−4; l.o.o. 0.070). Individuals from panel D are in red and marked with arrowheads. The use of the predictions from panels C and F as tests for actual above-average longevity (including sensitivity and specificity figures) are shown in Figure S2E and S2F.

