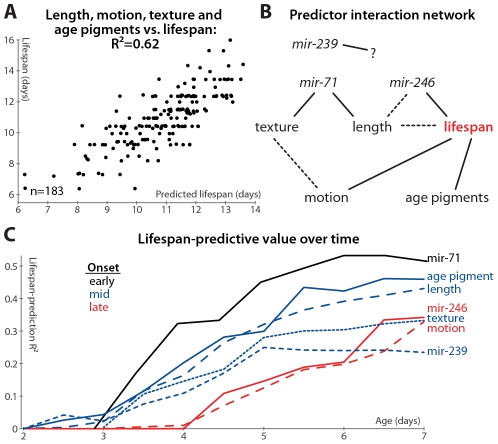
Figure 6. Multivariate lifespan predictions and relationships between biomarkers.
(A) Multivariate regression of length (days 3–7 mean and slope of fit line), motion (mean and slope), texture decrepitude (mean and slope), and autofluorescence accumulation (slope) against lifespan yields a predicted lifespan or “survival index” that explains 62% of variability in future longevity. (p<10−32; l.o.o. estimate 57%; see also Figure S2G). (B) A partial correlation network illustrates the pattern of conditional independences between measured parameters, which are directly connected if and only if they correlate with one another after controlling for all subsets of other parameters. The network shown is a consensus from several datasets (see Figure S6); dashed lines indicate relations that are not fully consistent, and mir-239 cannot be placed into the network at all. (C) Lifespan-predictive ability of each biomarker as a function of age. R2 values from regressing lifespan against biomarker measurements up to a given age are plotted versus that age. (Texture, motion, and mir-71::GFP PCA measures were calculated only from day 3 onward.)

