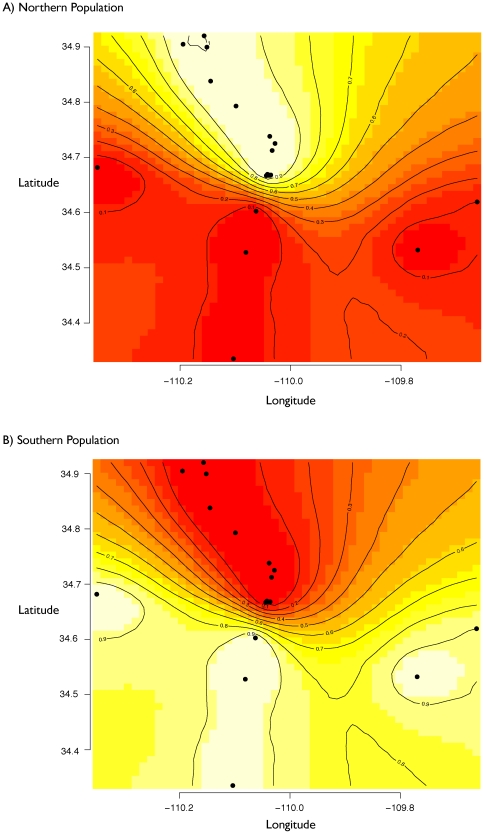
Figure 3. Spatially-explicit estimate of population clusters.
Geneland maps of the Sceloporus hybrid zone with individual pixels assigned to population clusters (K = 2: A, northern population; B, southern population). The highest posterior probabilities are in white and the lowest are in red, and the contour lines depict the spatial change in population assignment probability.

