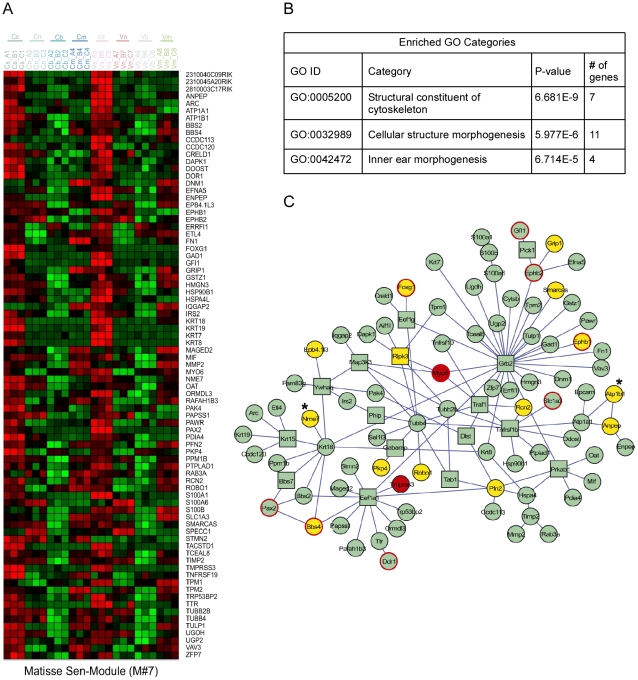
Figure 3. Expression-interaction module of genes which are highly expressed in sensory cells of the inner ear and are physically connected in the cellular protein-protein interaction web.
[A] Heat map showing the inner ear expression pattern of the genes in this module. [B] GO functional categories which are statistically over-represented in this module. [C] Physical links between the proteins encoded by the genes of this module. Node's shape (circle verses square): several proteins were added to the module by the algorithm to keep other members connected although they do not share the module's characteristic expression pattern. These proteins are displayed by box nodes. Node's color: Known deafness-related genes are marked in red; genes which are located within deafness loci are marked in yellow. Genes whose mutations were reported to result in malformation of the inner ear in mouse but do not underlie human disease are marked by red frame. ATP1B1 and NME7 are candidate genes for DFNA7 and are marked with asterisks. See also Figure S3.

