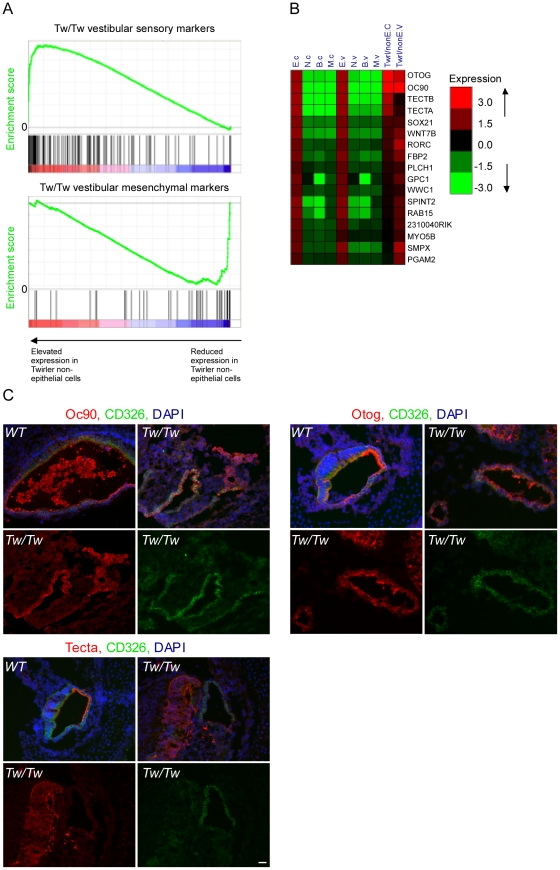
Figure 6. Deregulation of Zeb-1 pathway in the inner-ears of Twirler mutant mice.
[A] Top panel – gene expression analysis of CD326-negative cells sorted from Tw/Tw mice show increase in epithelial specific markers in the Tw/Tw mutants compared with their wild type littermate controls. Genes were sorted along the X-axis according to their fold-change between the two genotypes, and the distribution of epithelial marker genes in this sorted list was examined using Gene-Set Enrichment Analysis (GSEA) tool [40] (location of the marker genes in the sorted list is indicated by vertical bars). The epithelial marker genes were significantly enriched among genes whose expression was elevated in Tw/Tw CD326-negative cells (p = 1.2*10−15, Wilcoxon test). Lower panel - gene expression analysis of CD326-negative cells sorted from Tw/Tw mice shows decrease in mesenchymal specific markers in the Tw/Tw mutants compared with their wild type littermate controls (p = 1.72*10−10). [B] Many putative Zeb1 targets are de-repressed in CD326-negative cells in Tw/Tw mice inner ear. Log2 fold of change of genes with differential expression in the CD326-negative cells of the Tw/Tw mice compared with their wild type littermate controls. All listed genes harbor a Zeb1 binding site within their promoters. [C] The expression of Oc90, otogelin and α-tectorin is altered in the Tw/Tw mice. In wild type mice Oc90, otogelin and α-tectorin are expressed in the extracellular matrices and epithelial compartment, here marked in green by CD326. In Tw/Tw mice a robust expression of Oc90, otogelin and α-tectorin is noted also in the non-epithelial compartment (areas with expression of Oc90, otogelin and α-tectorin which do not overlap with CD326 expression). In each of the three panels the upper two figures represent merged images of the staining of the altered gene, CD326 and DAPI in wild type (left) and Tw/Tw ears (right) and the lower two figures show the unmerged staining of the altered gene (left) and CD326 (right). Scale bar = 50 µm.

