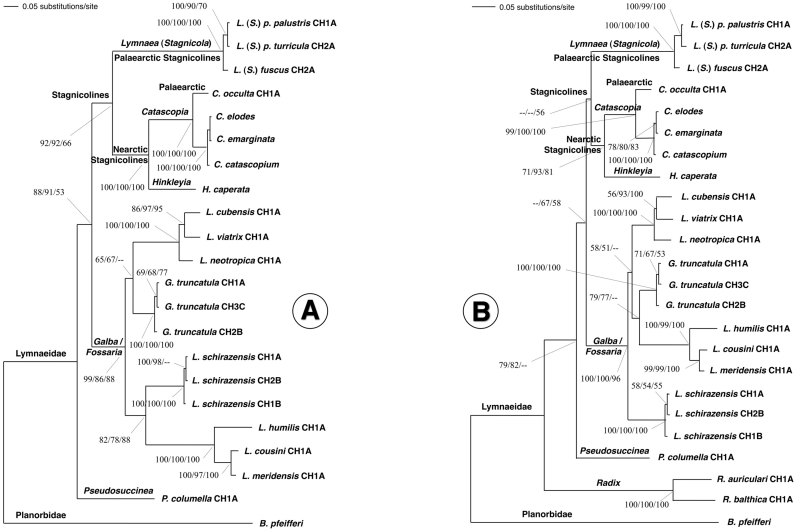
Figure 5. Phylogenetic trees of lymnaeid species studied based on maximum-likelihood (ML) estimates: A) data set of ITS-1 and ITS-2, with the planorbid B. pfeifferi as outgroup (−Ln = 10016.27013); B) same data set of ITS-1 and ITS-2 with B. pfeifferi as outgroup, after adding Radix species (−Ln = 10078.46520).
Scale bar indicates the number of substitutions per sequence position. Support for nodes a/b/c: a: bootstrap with NJ reconstruction using PAUP with ML distance and 1000 replicates; b: bootstrap with ML reconstruction using PAUP with 1000 heuristic replicates; c: Bayesian posterior probability with ML model using MrBayes. See Table S1 for systematic-taxonomic notes.

