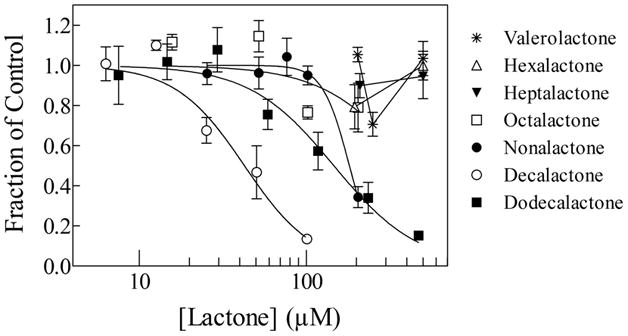
Figure 2.

Concentration-response curves of the effect of the tested alkyl lactones on planarian motility, as indicated. The lines were generated by fitting the data to equation 1. The fit parameters are shown in Table 1. Each data point represents the average of 8 to 14 worms; the error bars represent the standard error of the mean.
