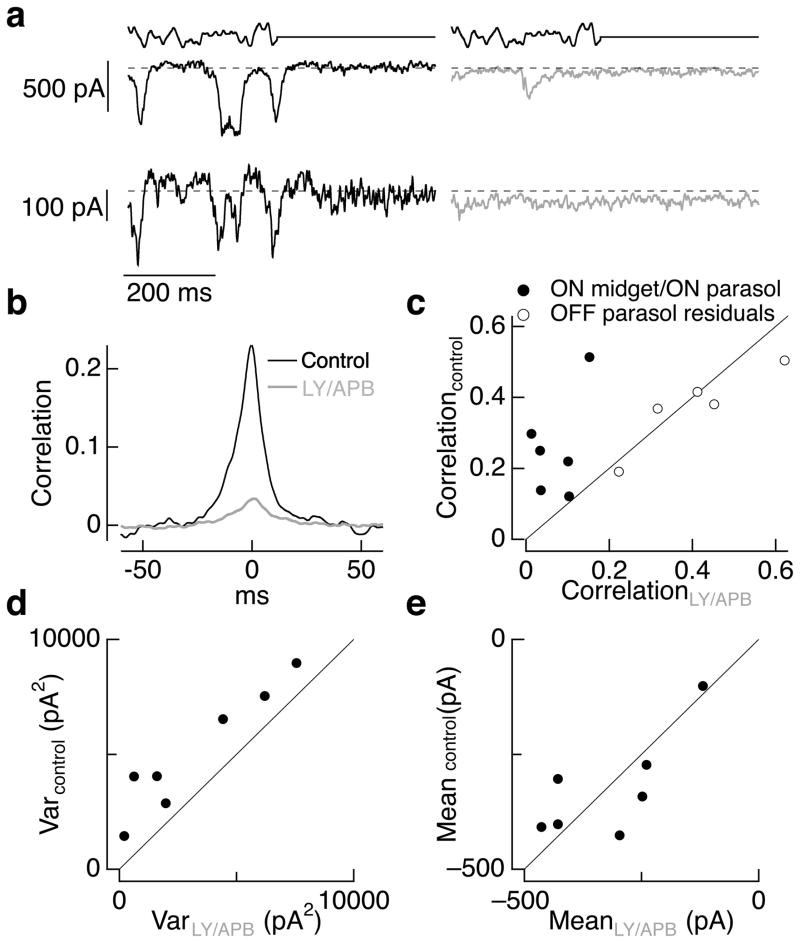
Figure 3.
Correlated and total noise in ganglion cell excitatory synaptic inputs are dominated by cone noise. a. Simultaneous recordings of excitatory synaptic input to an ON parasol (top) and an ON midget (bottom) ganglion cell before (left) and during (right) superfusion with a mix of 7.5 μM LY341495 and 4 μM APB. Dashed line shows the mean current level in constant light (4000 R*/cone/sec) prior to exposure to the drugs. b. Crosscorrelation functions measured during constant light before (black) and during (red) LY/APB for the same cell pair as a. c. Peak crosscorrelation before LY/APB exposure plotted against that during LY/APB for 6 ON parasol/ON midget cell pairs. Also shown are peak crosscorrelations for 5 OFF parasol pairs as a control; correlations were measured from the residuals during modulated light to minimize the effects of nonlinearities in the OFF circuitry (see Methods and ref. 26). d. Current variance from 0–100 Hz measured in ON parasol ganglion cells during control conditions plotted against that in LY/APB (including some recordings from single cells not in c). e. Mean currents during control conditions and LY/APB for the cells in d. The mean current in control conditions was 1.05 ± 0.10 times that in LY/APB.

