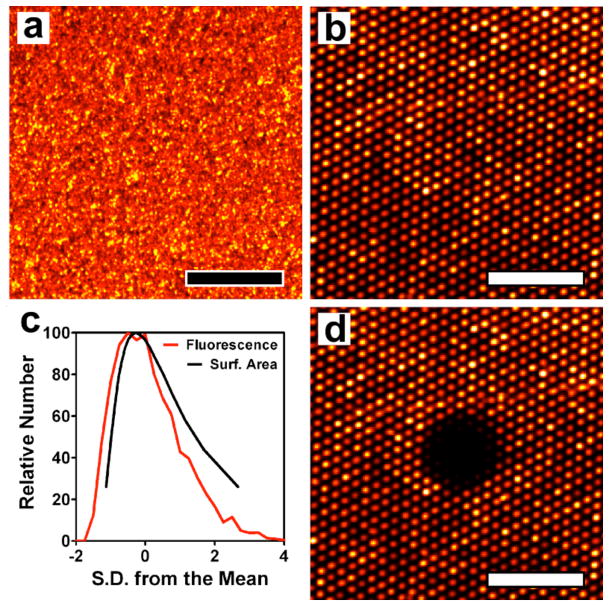
Figure 2.
Fluorescence images of a phospholipid vesicle microarray. (a) A microarray uniformly covered with Rho-PE-labeled egg PC vesicles before applying the PDMS squeegee. (b) A microarray after applying the squeegee showing 1 μm-diameter wells with 3 μm periodicity filled with vesicles. (c) Distribution of average fluorescence intensity (red) from 5200 microarray wells and the distribution of surface area (black) of vesicles extruded 21 passes through a 200 nm polycarbonate filter determined by dynamic light scattering. (d) Fluorescence image of the microarray in (b) 2 minutes after photobleaching a 25 μm-diameter area showing no fluorescence recovery. This indicates the material in the wells is isolated and that a supported lipid bilayer does not form spontaneously. The scale bars in a, b and d are 25 μm.

