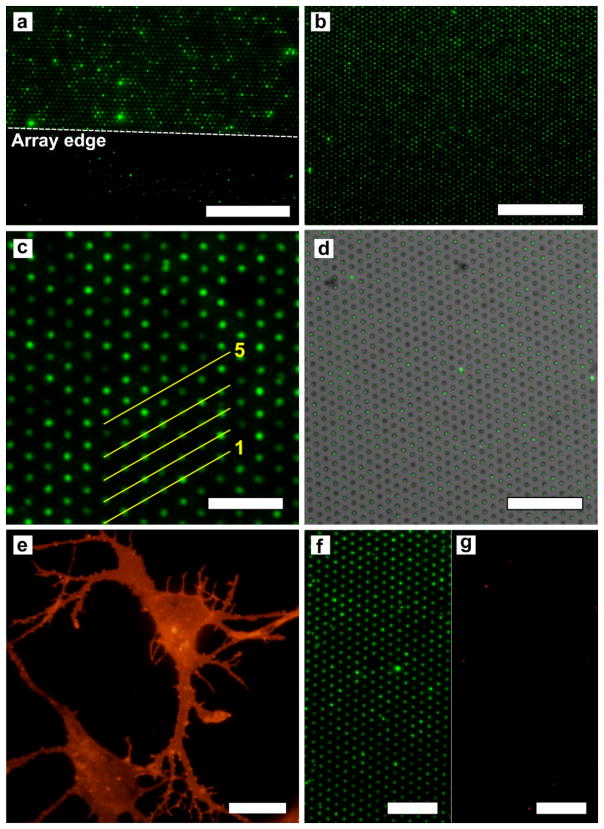
Figure 3.
Fluorescence images of natural membrane microarrays stained with FM1-43 and GM1 detection with CTX. (a) Myelin microarray showing the array edge, which is indicated by the dashed line. Beyond the edge of the array there is little adherent myelin. The scale bar is 50 μm. (b) Microarray formed with neuronal lipid rafts showing > 99% occupancy. The scale bar is 50 μm. (c) Magnified image of a microarray formed with neuronal lipid rafts. The line scans for lines 1 – 5 can be seen in Supporting Information Figure S5c. The scale bar is 10 μm. (d) A bright field image of a microarray with 1 μm-diameter wells with 3 μm periodicity overlaid with a fluorescence image of FM-143-stained lipid rafts assembled into the wells. In this image there are 975 wells, all of contain fluorescent lipid rafts, therefore the occupancy for this image is 100% over the approximately 80 μm × 80 μm area. The scale bar is 30 μm. (e) Cortical neurons in culture stained with TRITC-conjugated CTX. The scale bar is 10 μm. (f) Neuronal lipid raft microarray rendered fluorescent by CTX binding to GM1. The scale bar is 15 μm. (g) The same array as in (f) showing the red fluorescence channel, which indicates that very little SAPE binds to the neuronal lipid raft microarray. The scale bar is 15 μm.

