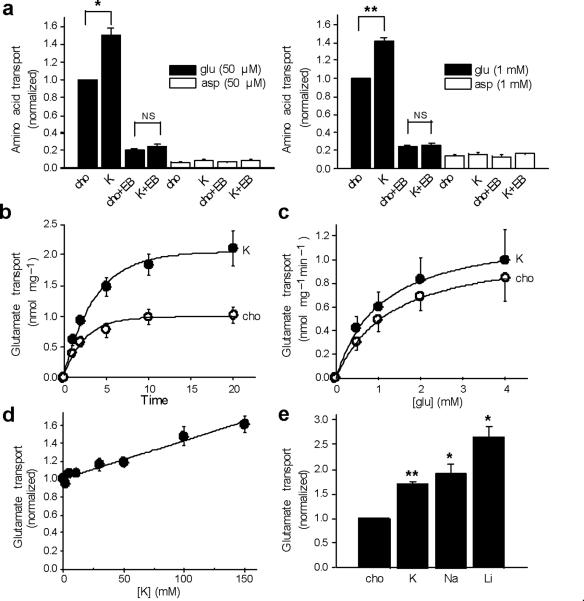
Figure 4. Monovalent cations increase glutamate transport into synaptic vesicles.
(a) The uptake of 3H-glutamate (filled bars) or -aspartate (open bars) by rat brain synaptic vesicles was measured at 10 minutes in assay buffer containing either 2 mM choline Cl and 148 mM choline gluconate (cho) or 2 mM KCl and 148 mM K gluconate (K), in either 50 μM or 1 mM amino acid, with or without VGLUT inhibitor Evans Blue (EB) (at 10 and 100 μM for left and right panels, respectively). Uptake was normalized to that observed with choline in the absence of Evans Blue. * p<0.05, ** p<0.01, NS indicates p=0.11 for left panel and 0.40 for right. n=3 (b, c) Time course (b) and kinetics (c) of glutamate uptake in either 150 mM choline (open circles) or 150 mM K+ (filled circles). The time course was performed using 1 mM glutamate, and the kinetic analysis at 1 minute, yielding mean Km 1.02 ± 0.08 mM for K and 1.27 ± 0.04 mM for cho (p<0.05), and mean Vmax 1.26 ± 0.33 nmol/mg and 1.12 ± 0.24 nmol/mg for K and cho, respectively (p=0.31). n=3 (d) Dose response of glutamate uptake to potassium, with total choline and K gluconate adjusted to 150 mM, and uptake normalized to that in no potassium. (e) Uptake of 1 mM 3H-glutamate for 10 minutes in the presence of 150 mM K, Na or Li gluconate, normalized to that in 150 mM choline. *, p<0.05 and **, p<0.01 relative to cho (n=3). Statistical analysis was by two-tailed, paired t-test, and values indicate mean ± SEM.

