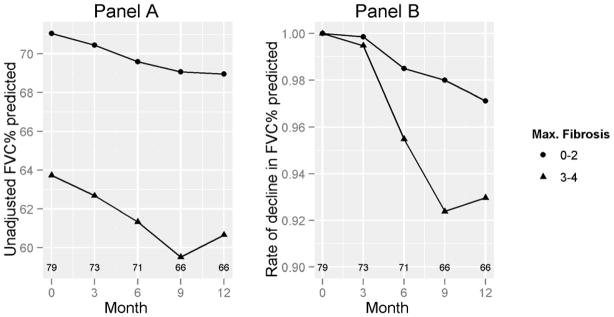
Figure 2. FVC% by baseline HRCT-maximum fibrosis score.
Panel A shows the decline in % FVC, stratified by maximum HRCT fibrosis at baseline. Panel B shows the rate of decline in FVC % predicted adjusted for the baseline FVC % predicted. Numbers above the X-axis represent numbers of subjects corresponding to the data points. P=0.008

