Figure 1.
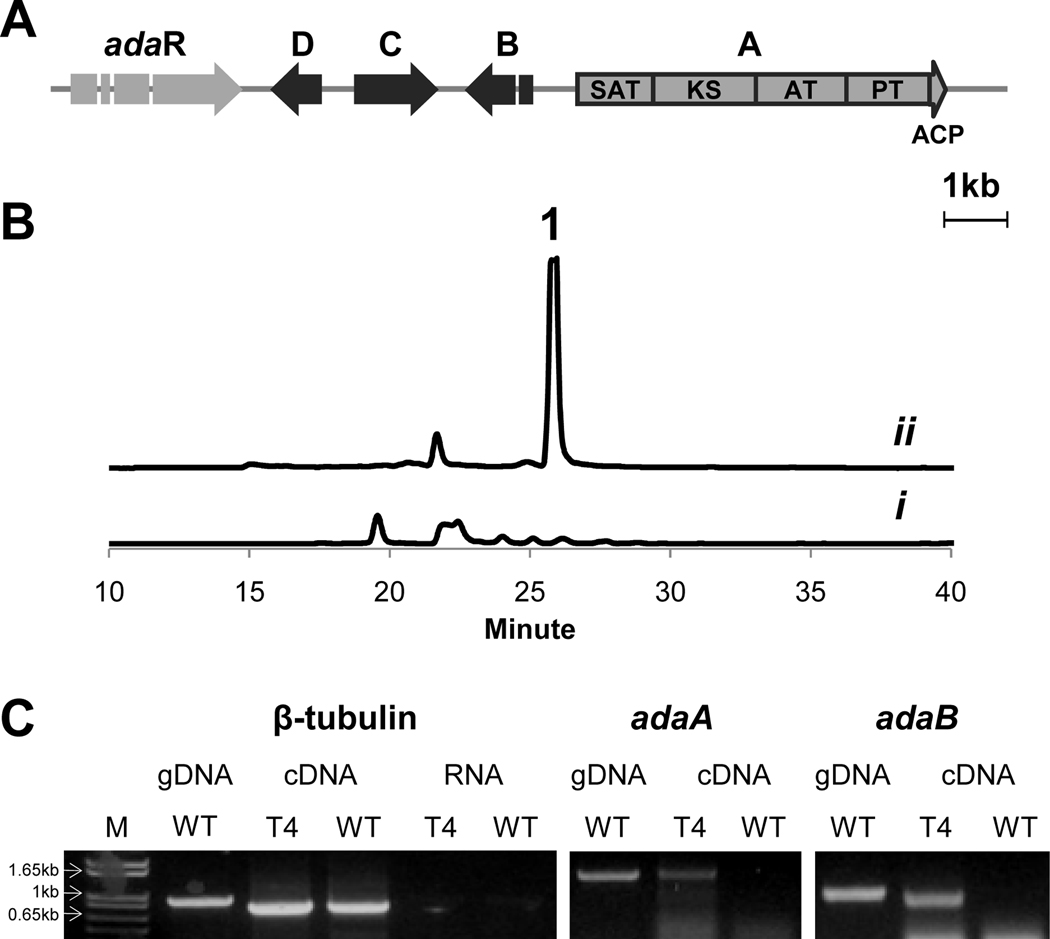
Induction of the ada gene cluster. (A) Organization of the ada gene cluster. (B) LC analysis (400 nm) of A. niger extracts: i. WT and ii. T4 transformant; (C) RT-PCR analysis of the ada genes with lane M as marker. The β-tubulin was used as a positive control and RNA only of both WT and T4 was used as negative controls. Regions of adaA and adaB were probed for inducted transcription.

