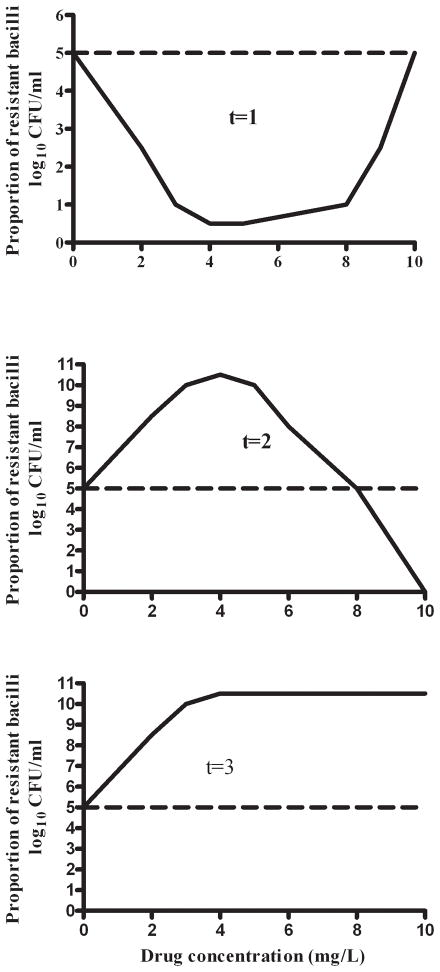
Figure 1. Change in size of drug-resistant M. tuberculosis population with exposure and time.
Figure shows an upright “U” at the beginning of therapy (t=1), which evolves to an inverted “U” curve at t=2, and eventually reaches a time when no concentration of the antibiotic in question can suppress drug resistance at t=3.

