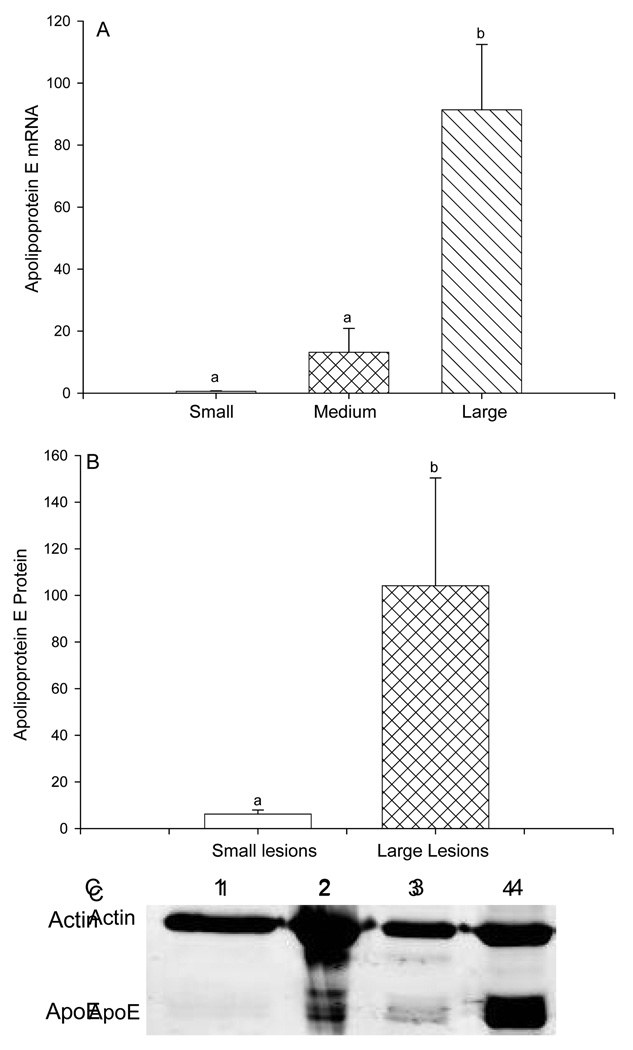
Figure 1.
Expression of apolipoprotein E (apo E) gene and protein in cynomolgus monkey iliac arteries stratified by plaque size. A: Apo E gene expression from DNA microarray data of iliac arteries containing small/absent (reference group), medium, or large atherosclerotic plaque. B and C: Apo E protein expression from immunoblot of iliac arteries containing small/absent (reference group) vs. large atherosclerotic plaque. Sizes of atherosclerotic plaque in the iliac arteries used for immunoblot analysis were mean plaque size 0.010 mm2, range 0–0.041 mm2 for the small/absent (reference) group, and mean plaque size 0.757 mm2, range 0.521–0.996 mm2 for the large group. B illustrates densitometry data of immunoblot analysis of apo E normalized to β-actin expression in monkey iliac arteries, mean ± SEM, n=4 paired samples. C shows a representative immunoblot of apo E and the loading control, β-actin. Lanes 1 and 3 contain protein from arteries with small (reference group) atherosclerotic lesions. Lanes 2 and 4 contain protein from arteries with large lesions.

