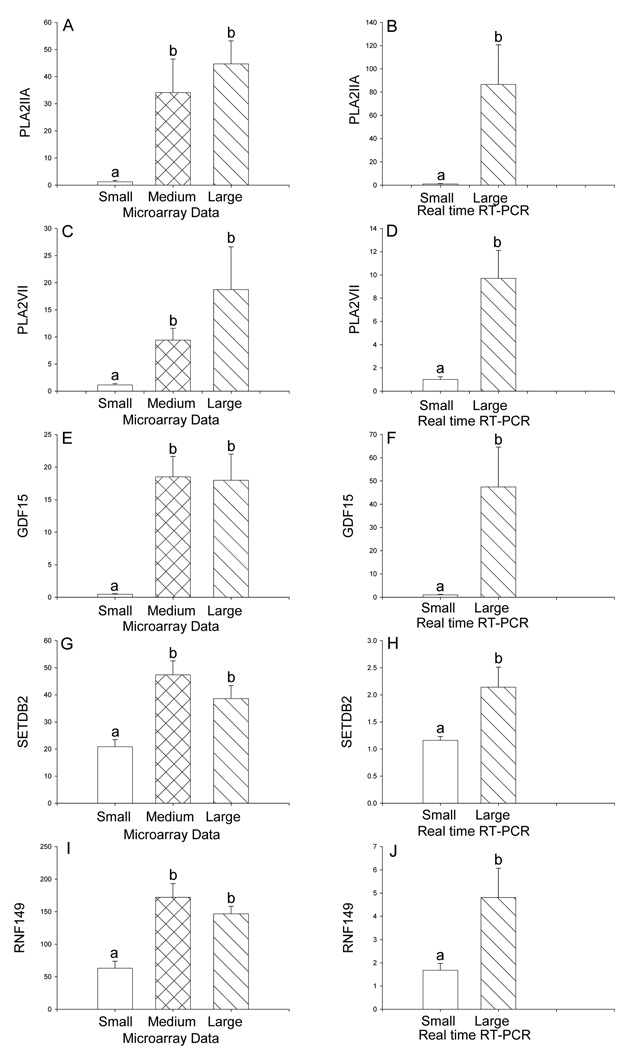
Figure 3.
Differential expression of phospholipase A2, group IIA (PLA2IIA) (A, B), phospholipase A2 group VII (PLA2VII) (C, D), growth differentiation factor 15 (GDF15) (E, F), SET domain, bifurcated 2 (SETDB2) (G, H), and ring finger 149 (RNF149) (I, J) in the iliac arteries of cynomolgus monkeys on a high fat diet stratified by size of atherosclerotic lesions. Panels A, C, E, G, I: Differential gene expression from DNA microarray analysis. The size of small (reference group) lesions was 0–0.113 mm2 (n=4), medium lesions were 0.30–0.542 mm2 (n=5), and large lesions were 0.61–1.003 mm2 (n=3). Panels B, D, F, H, J: Data from real time RT-PCR analysis. Statistical analysis utilized ANOVA followed by Newman-Keuls post hoc test (microarray data) or Student’s t-test (RT-PCR data). Data are expressed as the mean ± SEM. Bars with different letter superscripts denote that the data for those groups are significantly different from each other, p<0.05.

