
Figure 1.
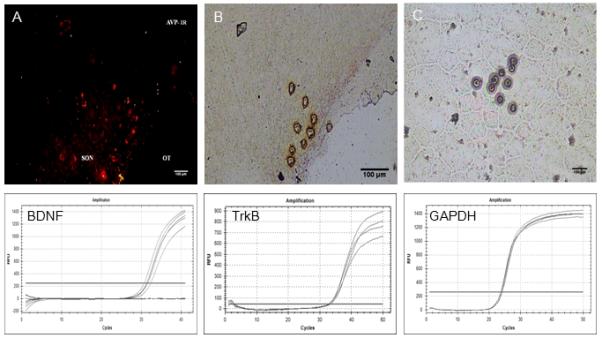
Top row: Digital images of vasopressin neurones in the SON identified by quick immunostaining (A), dissected by laser capture (B), and captured for later qRT-PCR analysis (C). Bottom row: Relative fluorescence (RFU) amplification curves for BDNF, TrkB, and GAPDH.