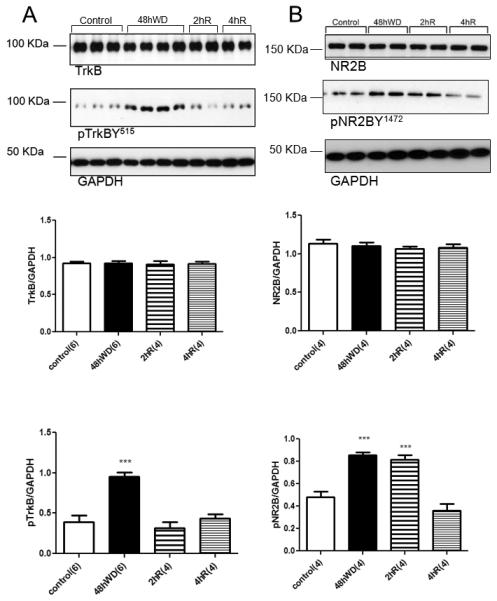
Figure 4.

Tyrosine phosphorylation of TrkB (pTrkBY515) and NR2B (pNR2BY1472) in the SON following water deprivation and rehydration with water. (A) Digital images of representative Western blot analysis for TrkB, pTrkBY515, and GAPDH from brain punches containing the SON from euhydrated control (control), water deprived rats (48hWD) rats, and rats given access to 2h (2hR) or 4h (4hR) water after water deprivation. Graphs represent densitometric analysis of TrkB and pTrkBY515 normalized to GAPDH. (B) Digital images of representative Western blots for NR2B, pNR2B and GAPDH from SON samples and graphs of the densitometry for NR2B and pNR2B normalized with GAPDH. *** Statistically significant, P<0.001. Parenthesis indicates number of animals.
