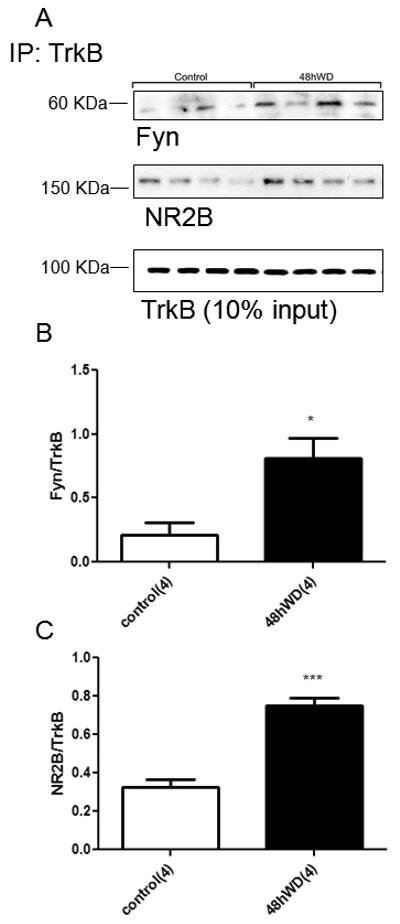
Figure 7.

Co-immunoprecipitation of TrkB and NR2B and Fyn kinase in the SON following 48hWD. (A) Digital images of representative western blot analysis for Fyn kinase, NR2B and TrkB from brain punches containing the SON subjected to co-IP. (B) Graph represents densitometry analysis of physical interaction between Fyn and TrkB in SON subjected to co-IP. Bands of interest were quantified by densitometry using the Scion program. (C) Graph represents densitometric analysis of physical interaction between NR2B and TrkB in SON subjected to co-IP. Bands of interest were quantified by densitometry using the Scion program. *** Statistically significant, P<0.001, * statistically significant, P<0.05. Parenthesis indicates number of samples (each sample represents a pool from two animals of the same treatment group).
