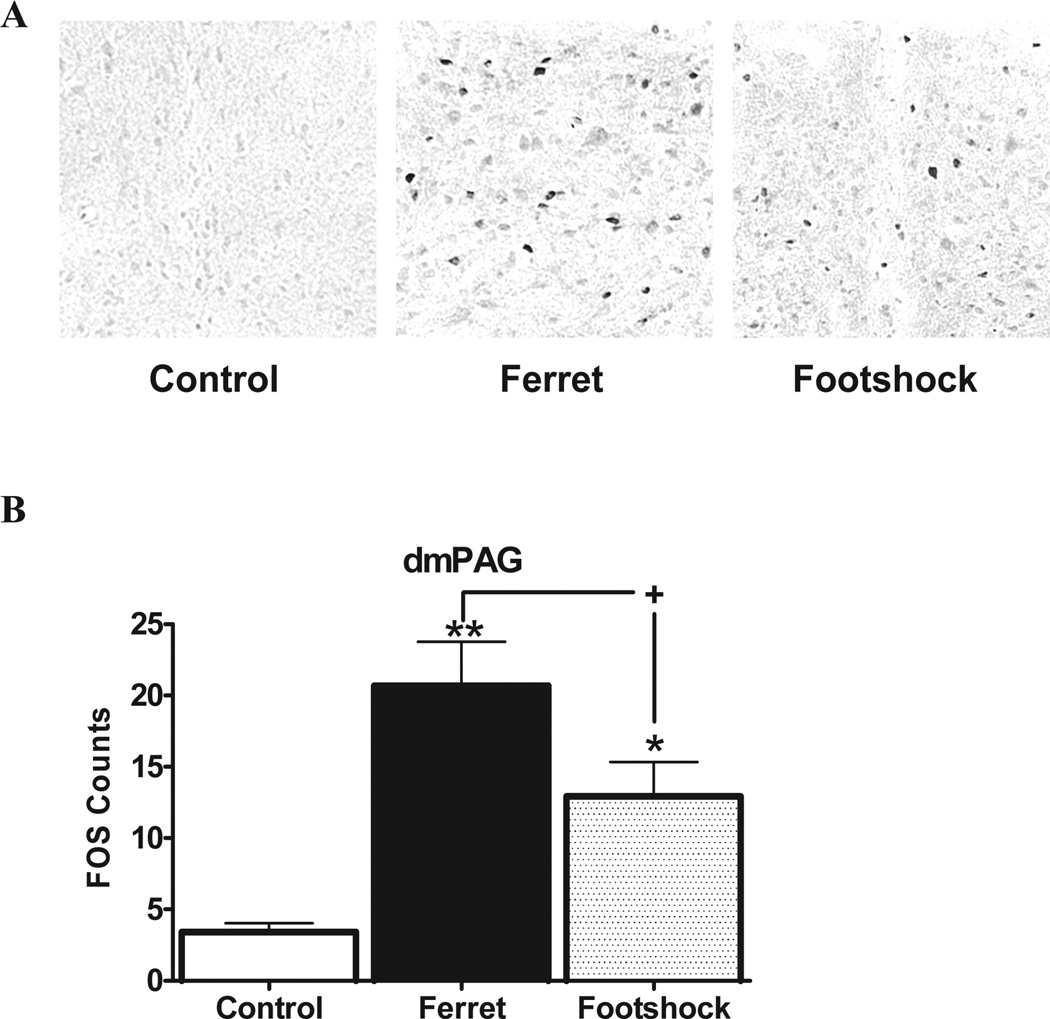
Figure 4.
A) Examples of Fos activation in the dorsomedial periaqueductal gray for each stress condition. B) Fos expression in the dorsomedial periaqueductal gray (dmPAG) is depicted as a function of stress condition. *p<0.05 and **p<0.01 relative to control group; +p<0.05 comparing stressors to each other.

