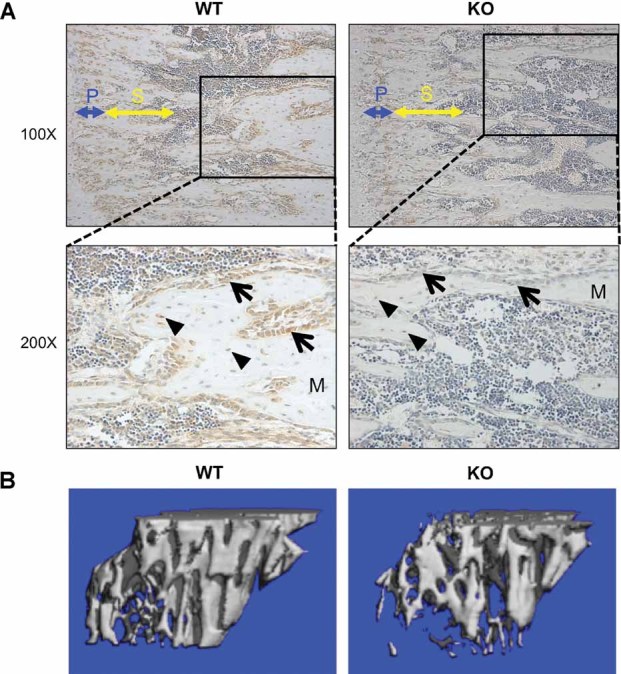
Fig. 1.

Reduced ETAR expression and trabecular bone volume in KO mouse tibias. (A) Tibias of WT and KO mice were analyzed for ETAR protein expression by immunohistochemistry. In ×100 magnification images, primary (blue) and secondary (yellow) spongiosae are indicated. Inset boxes correspond to ×200 magnification images. Arrows indicate osteoblasts, and triangles indicate osteocytes. M = bone matrix. (B) µCT images showing reconstructions of proximal tibia trabecular bone demonstrating lower trabecular bone volume in KO mice.
