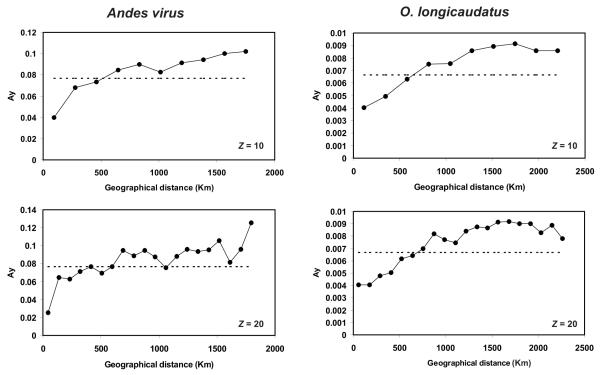
Figure 3.
Results of spatial autocorrelation analyses of ANDV (S segment) and O. longicaudatus in Chile. Analyses were performed using Z = 10 and 20 distinct distance classes. Ay: Average pairwise genetic distances of haplotypes that fall within the boundaries specified for distance class y. Horizontal dotted lines indicate the average pairwise genetic distance from full data set.

