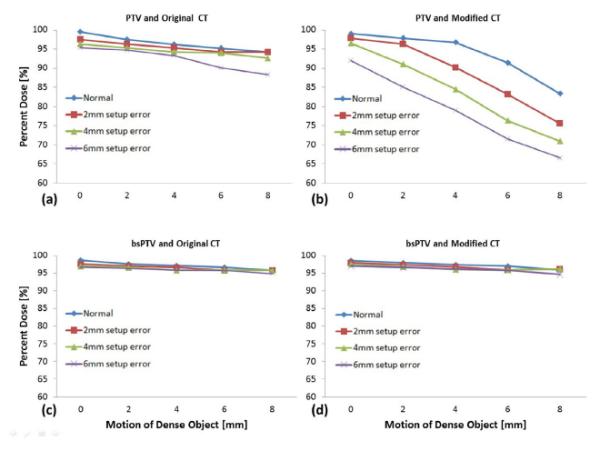
Fig. 4.

The minimum percentage of prescribed dose to the CTV for (a) plans using PTV simulated with original CT data, (b) plans using PTV with 3% up-scaled CT data, (c) plans using the bsPTV with original CT data, and (d) plans using bsPTV with 3% up-scaled CT data. The lines represent different setup errors ranging from 0 mm to 6 mm while the horizontal axis represents increasing motion errors of the dense object from 0 mm to 8 mm.
