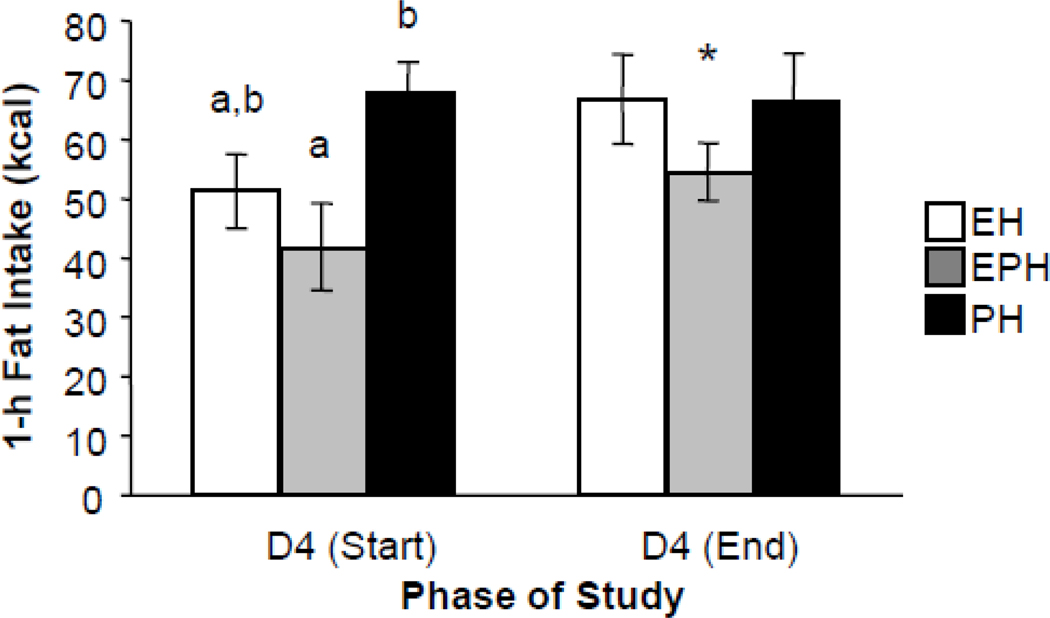
Figure 2.
Effect of hormone treatment on 1-h fat intake on the first and last Day 4 of the study. D=Day, E=Estradiol, P=Progesterone, EP=Estradiol/Progesterone. One-h intake differed among the groups at the start of the study, but not at the end of the study. Different small letters indicate significant differences among the groups. Asterisk indicates a significant difference between intakes on Day 4 (start) and Day 4 (end) in the EPH group.

