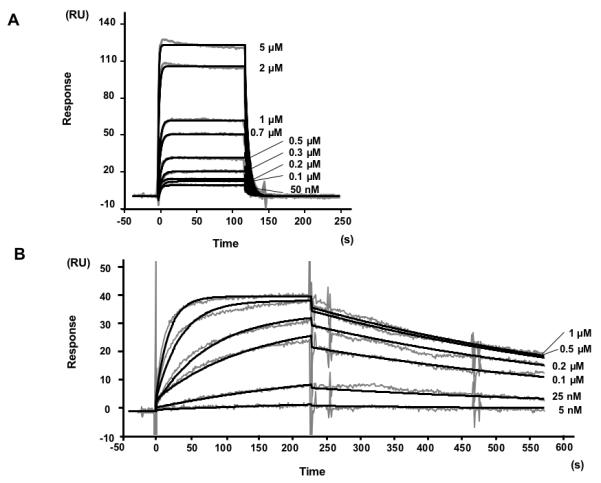
Fig. 2.

Biacore datasets used for kinetic analysis of the interactions of MBP-BPV1 E6 with peptides containing (A) the LXXLL motif of E6AP and (B) the N-terminal LXXLL motif of paxillin. Gray lines represent SPR sensorgrams obtained by injecting analyte MBP-E6 on surfaces capturing 60 (A) and 30 (B) RUs of GST-peptide ligand. The concentration of analyte is indicated on the right hand side of each sensorgram. Black lines are the global fits of the sensorgrams to a simple bimolecular Langmuir model. The ratio of the globally fit Rmax (Rmaxglobal) over the theoretical Rmax (Rmaxtheoretical -estimated from the amount of fusion peptide captured-) Rmaxglobal/Rmaxtheoretical was 0.9 and 0.6 for the GST-paxillin and GST-E6AP ligands. Kinetic parameters are reported in Table 1.
