
Figure 2.
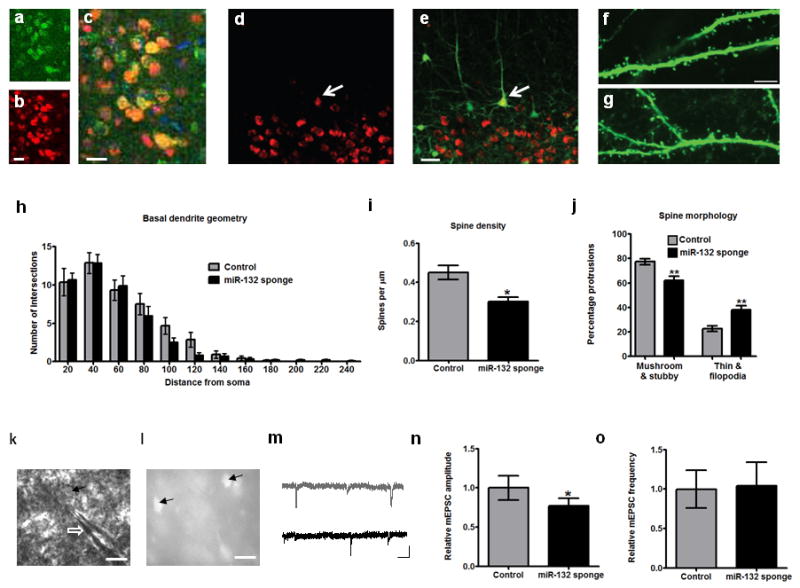
Structural and electrophysiological effects of miR-132 inhibition. (a-c) Expression of (a) p250GAP, (b) mCherry, as well as their (c) co-localization in mCherry-miR-132 sponge-expressing neurons. DAPI staining is seen in blue in (c). Scale bars = 25 μm. (d-e) Confocal microscope images from GFP-S transgenic mice showing layer 5 mCherry-miR-132 sponge-expressing neurons. mCherry expression is shown in (d), and co-localization with GFP in (e). White arrows point to mCherry and GFP positive neuron used for structural analysis. Scale bar = 50 μm. (f-g) Representative confocal images from secondary dendritic branches of (f) control and (g) miR-132 sponge-infected layer 5 pyramidal neurons used for spine analysis. Scale bar = 5 μm. (h-j) Results (all shown as mean ± S.E.M.) from analysis of (h) dendritic arborization (Sholl analysis), (i) spine density, and (j) spine morphology of sponge-infected and control neurons. One asterisk denotes P < 0.05 and two asterisks P < 0.01, based on two-tailed Student's t test. (k) DIC image showing whole-cell patched pyramidal neuron (arrow) in layer 2/3 of mouse V1. Shadow of patch pipette marked by white open arrow. Scale bar = 20 μm. (l) Image of the same slice showing miR-132 sponge-infected cells (arrows). Scale bar = 40 μm. (m) Representative traces showing mEPSCs recorded from miR-132 sponge-infected and non-infected cells (shown in black and gray, respectively). Scale bar denotes 20 pA, 0.5 sec. (n-o) Histogram showing (n) mean ± S.E.M. amplitude and (o) frequency of mEPSCs recorded from control non-infected (gray) and infected neurons (black; n=9 neurons per group).