Figure 3.

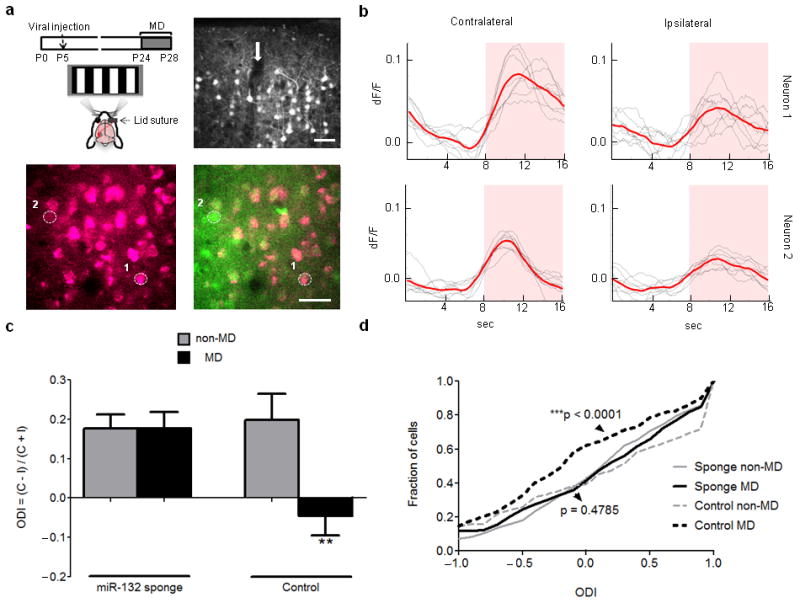
In vivo inhibition of miR-132 in V1 neurons disrupts their ocular dominance plasticity. (a) Top left: Schematic of experimental design. Top right: Images from confocal microscopy showing mCherry expression in cortical layers 1-3 at P28 following neonatal injection (arrow) of mCherry-miR-132 sponge-expressing lentivirus. Bottom: Two-photon microscope image showing mCherry expression alone (left) and its overlay with OGB (green) fluorescence (right) in an injected animal that underwent MD; selected neurons used for (b) are circled and numbered. Scale bars = 40 μm. (b) Example of contralateral and ipsilateral eye-driven calcium responses of the neurons shown in (a) that express high (top – neuron 1) or low (bottom - neuron 2) levels of mCherry-miR-132 sponge. Pink shaded area indicates period with visual stimulus. Calculated ODIs are: 0.73 (top – neuron 1), and 0.55 (bottom – neuron 2). (c) Ocular Dominance Index values (ODI = (contra – ipsi) / (contra + ipsi); mean ± S.E.M.) derived from peak visual responses obtained by two-photon calcium imaging in mice injected with mCherry-miR-132 sponge-expressing lentivirus. Black bars show animals subjected to 4 day MD and light gray bars show animals not subjected to MD: miR-132 sponge non-MD: 5 animals, 290 neurons; miR-132 sponge MD: 4 animals, 232 neurons; control non-MD: 3 animals, 120 neurons; control MD: 3 animals, 177 neurons. Note the lack of ODI shift following MD for mice that were injected with miR-132 sponge but not control virus. Control MD animals show a significantly larger ocular dominance shift compared to each of the other conditions (P < 0.01, Mann-Whitney test comparing neurons; P < 0.05 treating each animal as a single datum). (d) Cumulative histogram of ODI data shown in (c). There is a significant difference between control MD and non-MD neurons (black and light gray dotted lines respectively), but not between miR-132 sponge-infected MD and non-MD neurons (black and light gray lines, respectively). P-values shown are based on Kolmogorov–Smirnov test.
