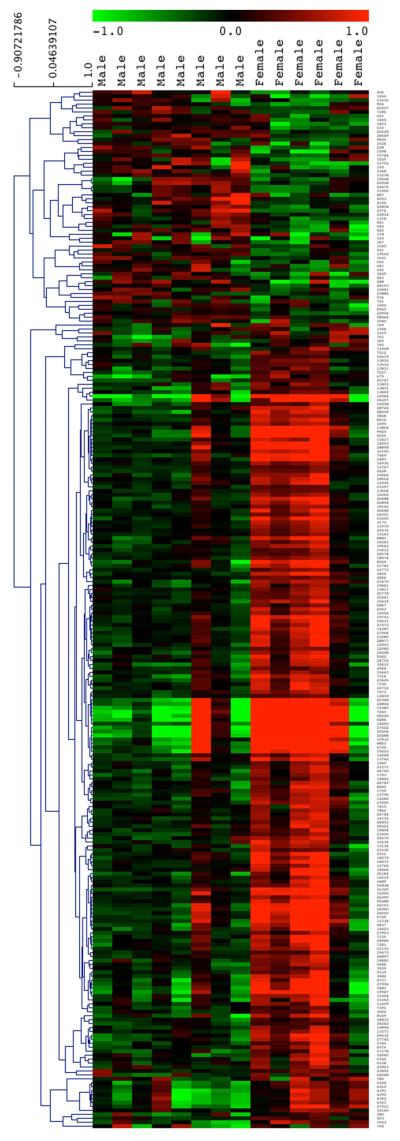
Figure 1.
Hierarchical cluster analysis of differentially expressed genes in hippocampus from male or female non-lead exposed control animals. The majority of differentially regulated genes between control male and female rats showed a greater expression in females than in males. Green indicates down-regulation of a gene; red indicates up-regulation relative to the median. Dendrogram on the left side of the gene list indicates clustering.

