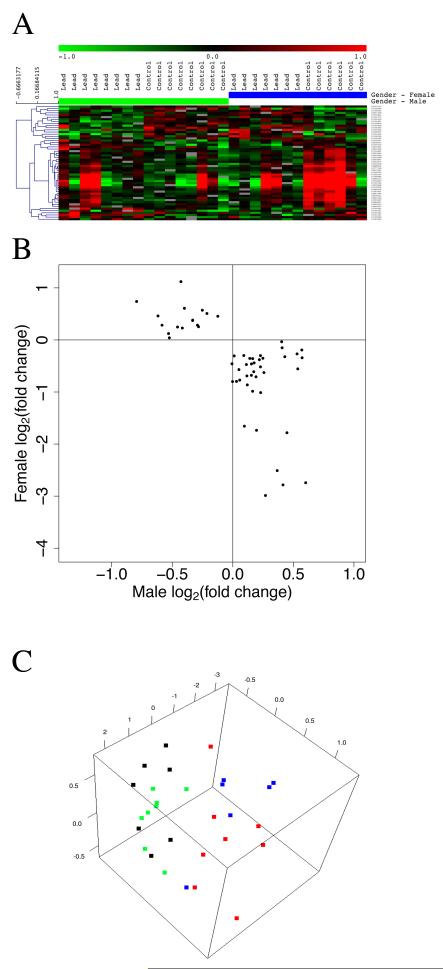
Figure 5.
Significant overall effect of lead exposure with differentially expressed genes in the hippocampus in opposite directions in males and females. A. Hierarchical cluster analysis of differentially expressed genes in hippocampus from control and lead exposed female or male rats. Green indicates down-regulation of a gene; red indicates up-regulation relative to the mean. Dendrogram on the side of gene list indicates clustering. B. Scatter plot comparing male and female average gene expression responses. C. Multi-dimensional scaling analysis of the gene expression shown in panel A. Color legend is the same as in Figure 2.

