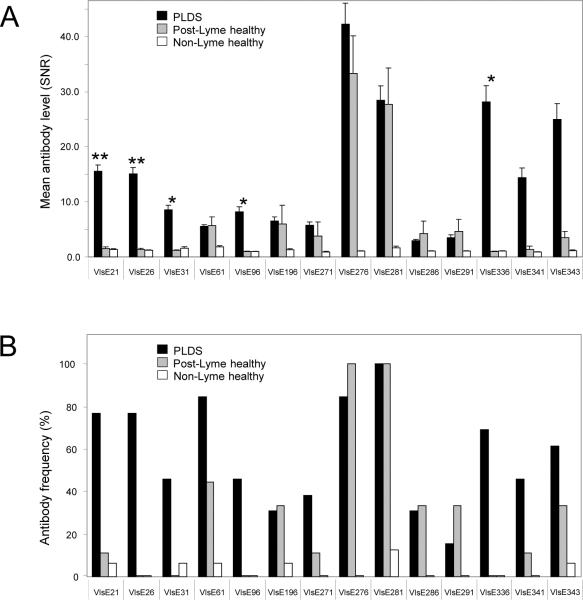
Figure 2. Level and frequency of antibody reactivity to differentially targeted peptides of VlsE, as determined by peptide microarray epitope mapping.
A) Mean level of antibody reactivity to each of the 14 peptides in PLDS (n=13), post-Lyme healthy (n=9), and non-Lyme healthy (n=16) groups. Error bars represent the standard error of the mean. Among these 14 peptides, reactivity towards 5 peptides, forming 3 contiguous amino acid sequences, was significantly higher in the PLDS group than in the post-Lyme healthy group. These peptides are shown by asterisks (1 asterisk indicates p<0.05, while 2 asterisks indicates p< 0.01 for the comparison between PLDS and post-Lyme healthy groups. B) Frequency of positivity for IgG antibodies to each of the 14 peptides in the PLDS, post-Lyme healthy, and non-Lyme healthy groups.

