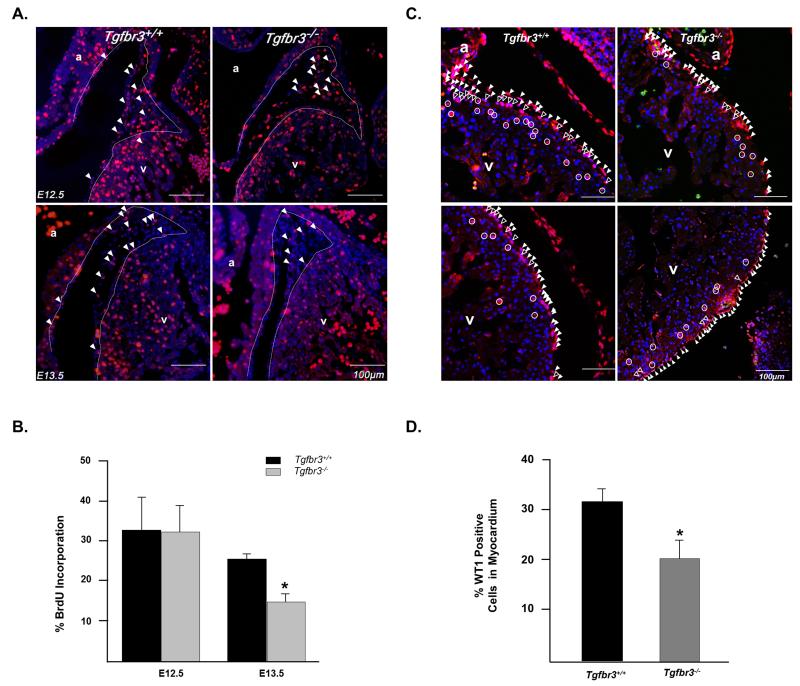
Figure 1. Epicardial cells in Tgfbr3−/− embryos show decreased proliferation and invasion in vivo.
(A) Heart sections from E12.5 and E13.5 embryos stained for BrdU. Representative BrdU positive cells are indicated by solid arrowheads. White dashed line demarcates myocardium from the epicardium and subepicardial space. (B) Percent proliferation is the number of BrdU positive cells per total number of DAPI stained nuclei (n= 3 embryos per genotype, per stage (*p<0.05)). (C) Sections stained for WT1 in E13.5 hearts. Representative WT1 positive mesenchymal cells are identified by the open circles. Representative cells in the epicardium are indicated by solid arrowheads, while epicardially derived mesenchymal cells in the subepicardial space are identified by the open arrowheads. (D) Percent invasion into myocardium is calculated as the number of WT1 positive mesenchymal cells per total WT1 positive cells (n=3 embryos per genotype (*p<0.05)). (a=atria, v=ventricle)

