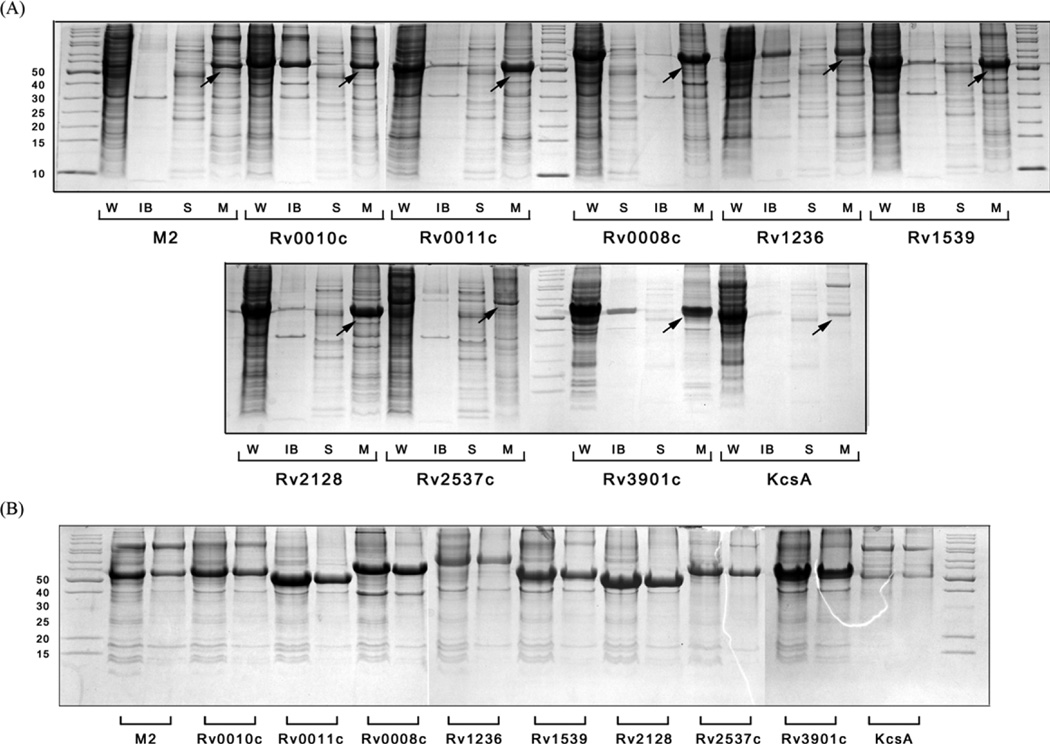
Figure 2.
(A) The distribution of ten overexpressed mMBP fusions in different cell fractions. “W” denotes whole cell sample, “IB” denotes inclusion body fraction, “S” denotes the soluble fraction and “M” denotes the membrane fraction. The overexpressed fusion proteins in the membrane fraction are indicated by the arrows. (B) Washing of the membrane fraction with basic urea solution. For each protein, left lane: before washing, right lane: after washing.

