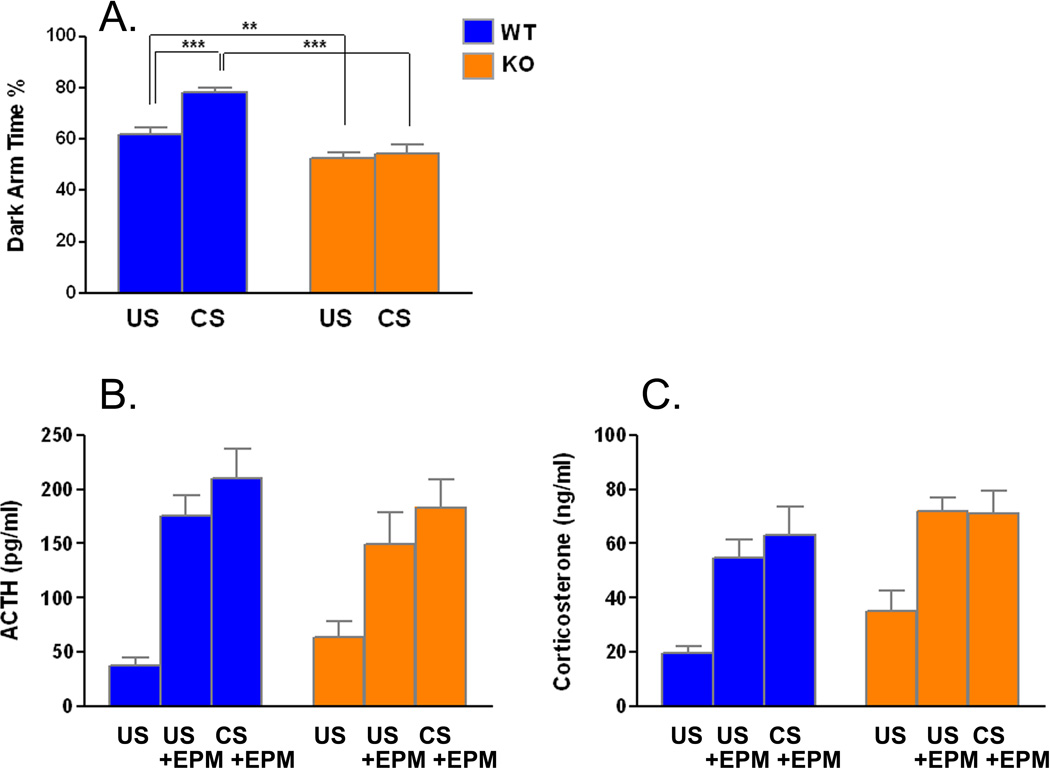
Figure 2.
A. Effects of chronic restraint stress on percent time spent in closed arms of the elevated plus maze in WT (US, n=24; CS, n=19) and Fmr1 KO (US, n=24; CS, n=19) mice. Bars are the means ± SEMs. Data were analyzed by means of ANOVA with genotype (WT, KO), treatment (US, CS) as factors. The genotype × treatment interaction (F(1, 82) = 7.753, p = 0.007) was statistically significant. Specific differences between groups were assessed for statistical significance by means of post-hoc Bonferroni t-tests (**, p<0.01; ***, p<0.001). Plasma concentrations of ACTH (B.) and corticosterone (C.) in WT (US, n=9; US+EPM, n=9, CS+EPM, n=10) and Fmr1 KO (US, n=10; US+EPM, n=9, CS+EPM, n=10) mice measured after five min in the EPM. Bars are the means ± SEMs. Data were analyzed by means of ANOVA with genotype (WT, KO), treatment (US, US+EPM, CS+EPM) as factors. B. ACTH. The genotype × treatment interaction (F(2, 51) = 0.921, NS) and the main effect of genotype (F(1, 51) = 0.229, NS) were not statistically significant, but the main effect of condition (F(2, 51) = 23.515, P<0.0001) was. C. Corticosterone. The genotype × treatment interaction (F(2, 51) = 0.203, NS) was not statistically significant, but the main effects of both genotype (F(1, 51) = 5.069, P=0.029) and condition (F(2, 51) = 17.626, P<0.0001) were.

