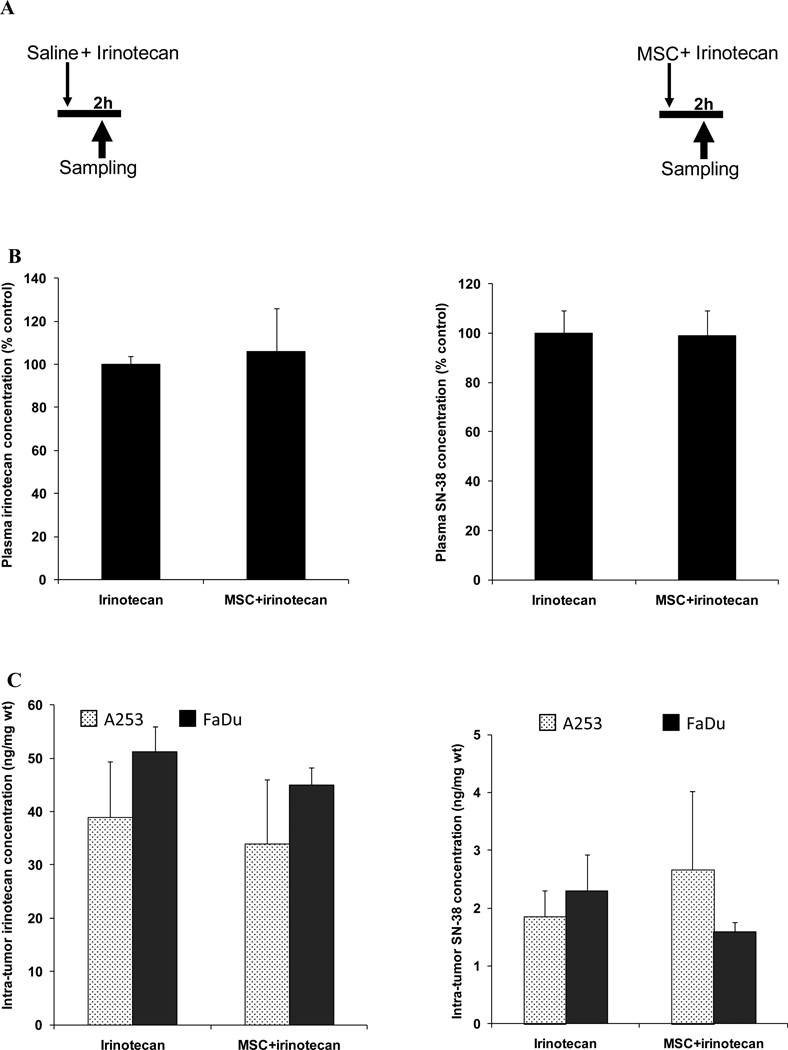
Figure 1. Drug concentrations after the concurrent treatment schedule.
Panel A is the treatment schedule with irinotecan alone or in concurrent with MSC.
Panel B is plasma irinotecan or SN-38 concentrations 2h after treatment with 100mg/kg irinotecan alone or after the concurrent combination treatment with MSC (0.2 mg/d) and irinotecan.
Panel C is the irinotecan or SN-38 concentration in A253 or FaDu 2h after treatment with 100mg/kg irinotecan alone or in concurrent combination with MSC (0.2 mg/d).
The figure shows no significant difference in drug concentration after the concurrent combination treatment when compared with irinotecan alone.

