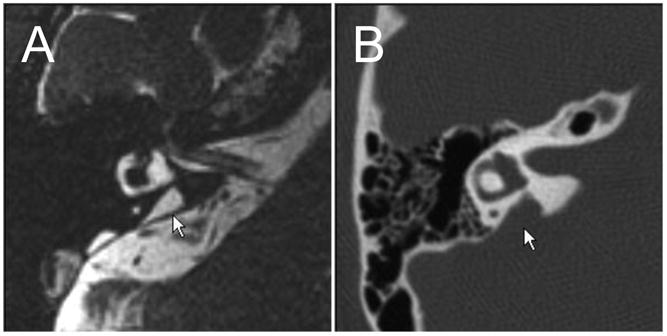
Fig 1.

Radiologic imaging of an enlarged vestibular aqueduct. A) Axial computed tomography (CT) scan of an enlarged vestibular aqueduct (arrow). B) Axial MR (magnetic resonance) image of the soft tissue correlate of an enlarged vestibular aqueduct: an enlarged endolymphatic duct and sac (arrow). Reproduced from http://www.nidcd.nih.gov/health/hearing/eva-intro.htm.
