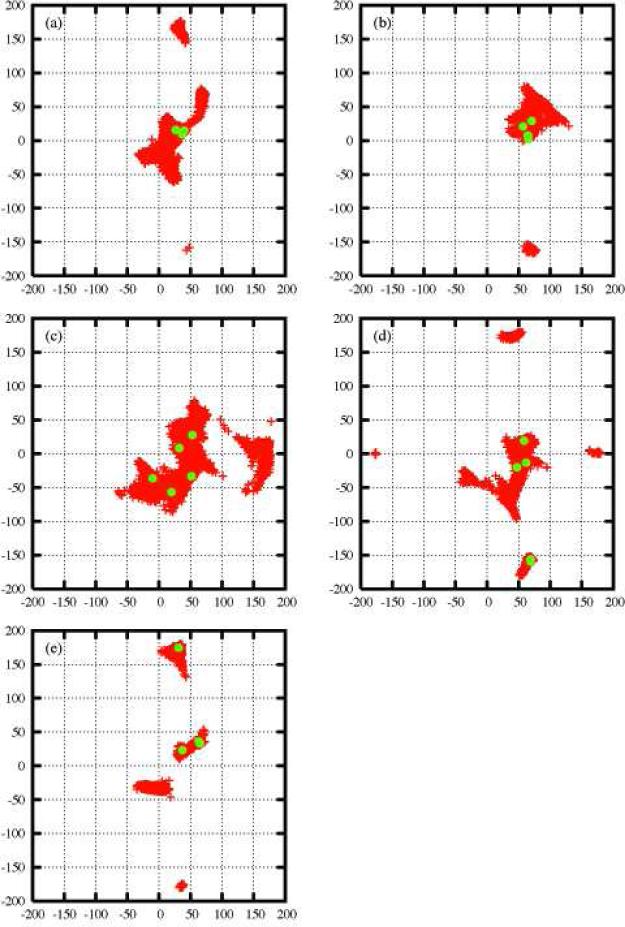
Figure 1.
Distribution of conformations in φ−ψ glycosidic space in the case of LND-1. Red points represent the conformers generated by the FSPS algorithm. The green points are the conformations with highest weights derived from the GA multi-structure fitting to RDCs. (a) Link 1, (b) Link 2, (c) Link 3, (d) Link 4 and (e) Link 5.

