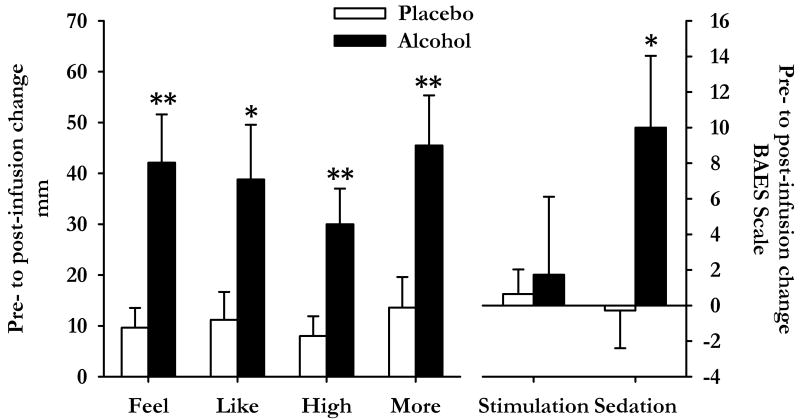
Figure 2.
Subjective responses to intravenous alcohol and placebo after the control task. The graphs show responses to infusion 1 during the control session among participants in group Alc0 (N=11, alcohol, filled bars) and group Alc30 (N=14, placebo, open bars). Data indicate mean±SEM change from pre-infusion baseline for the DEQ (left hand side) and BAES (right hand side). Asterisks indicate a significant difference between the groups (Student's independent samples t-test, *p<0.05 **p<0.01).

