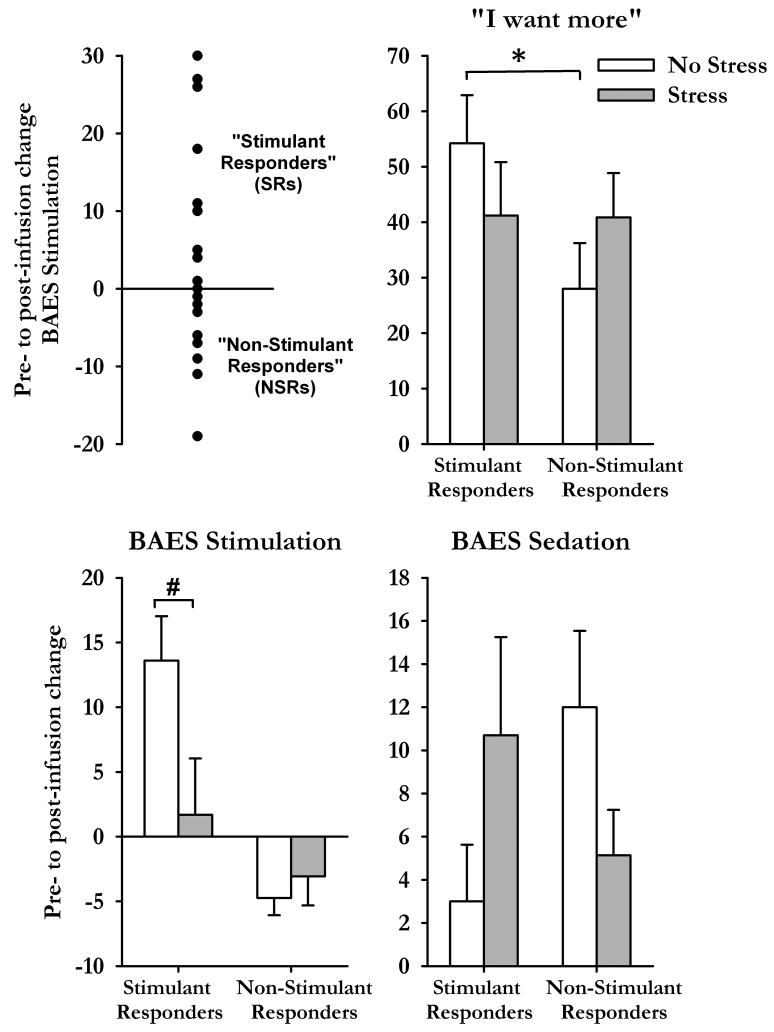
Figure 3.
Individual differences in response to alcohol after the TSST and non-stressful tasks. Top left graph shows scores of BAES Stimulation for all participants after the non-stressful task and classification of subsets of participants. Bar charts illustrate changes (from pre-infusion baseline, mean±SEM) in subjective responses to alcohol after the TSST (shaded bars) and control task (open bars) for participants classified as Stimulant or Non-Stimulant Responders. Asterisks indicate a significant difference between the groups (Student's independent samples t-test, p<0.05) and # indicates a significant difference between the tasks (Student's Paired t-test, p<0.05).

