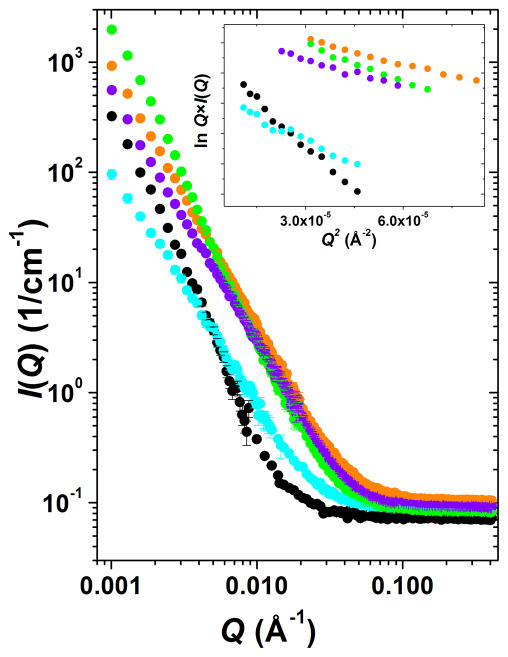
Figure 10.
I(Q) vs. Q SANS profiles for multi-component biopolymer networks: chitosan, cyan; alginate, black; chitosan + alginate, orange; chitosan + alginate + CaCl2, violet; chitosan + alginate + chondroitin, light green. Greater I(Q) values correspond to larger scattering particles, e.g., the (chitosan + alginate + chondroitin) mixture forms the biggest assemblies. Inset plot shows Guinier plots for rodlike particles, lnQ*I(Q) vs. Q2, and the linearity in this region confirms the formation of elongated fibers in all systems. Color code on inset corresponds to main figure. Statistical error bars correspond to one standard deviation and represent error in the scattering intensity estimation. Error bars are large at the instrument configuration overlap region but are smaller than the plotting symbols at low Q.

