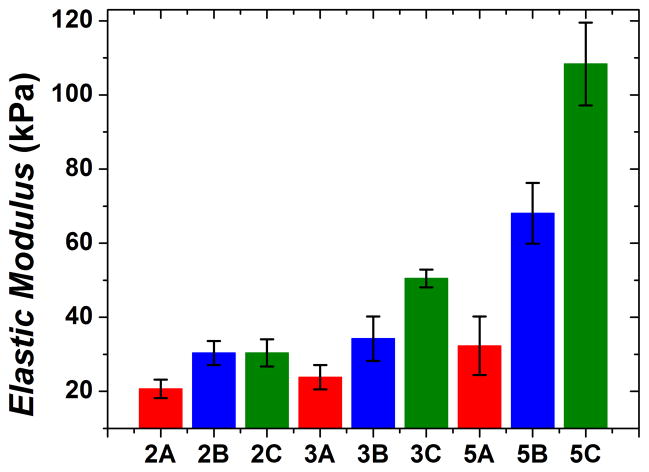
Figure 3.
Elastic modulus of each hydrated sample type. As total polysaccharide concentration increased, elastic modulus also increased. Samples are identified by mixing order (A, B or C) and by initial mass fractions of chitosan and alginate used (2%, 3% or 5%). Mechanical testing results are presented as the average of five sample tests with the standard deviation reported as the error. The error bars correspond to one standard deviation. Such applies to Figures 3, 6 and 7 as well.

