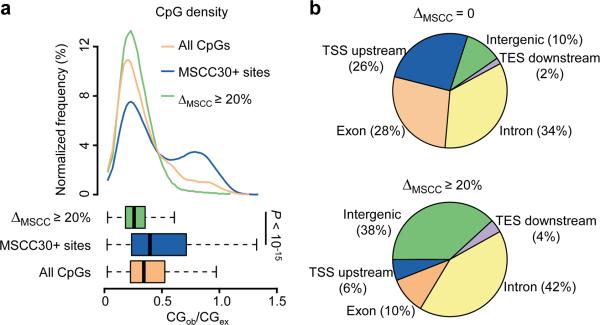
Figure 5.
Genomic characteristics of activity-modified CpGs. (a) Enrichment of activity-induced methylation changes in regions with low CpG density. Top: distributions of CpG densities of 500 bp windows flanking activity-modified CpGs (green), all MSCC 30+ sites (blue), and all CpGs in the mouse genome (orange); Bottom: boxplots showing median and quartiles of the three distributions (P value, Student's t-test). (b) Distribution of modified CpGs in different genomic subregions. Shown are pie-charts of unchanged (top) and activity-modified CpGs (bottom) mapped to each genomic subregion. TSS upstream: within 5 kb upstream from the transcription start site (TSS); TES downstream: within 5 kb downstream from the transcription end site (TES); intergenic: over 5 kb away from any known genes.

