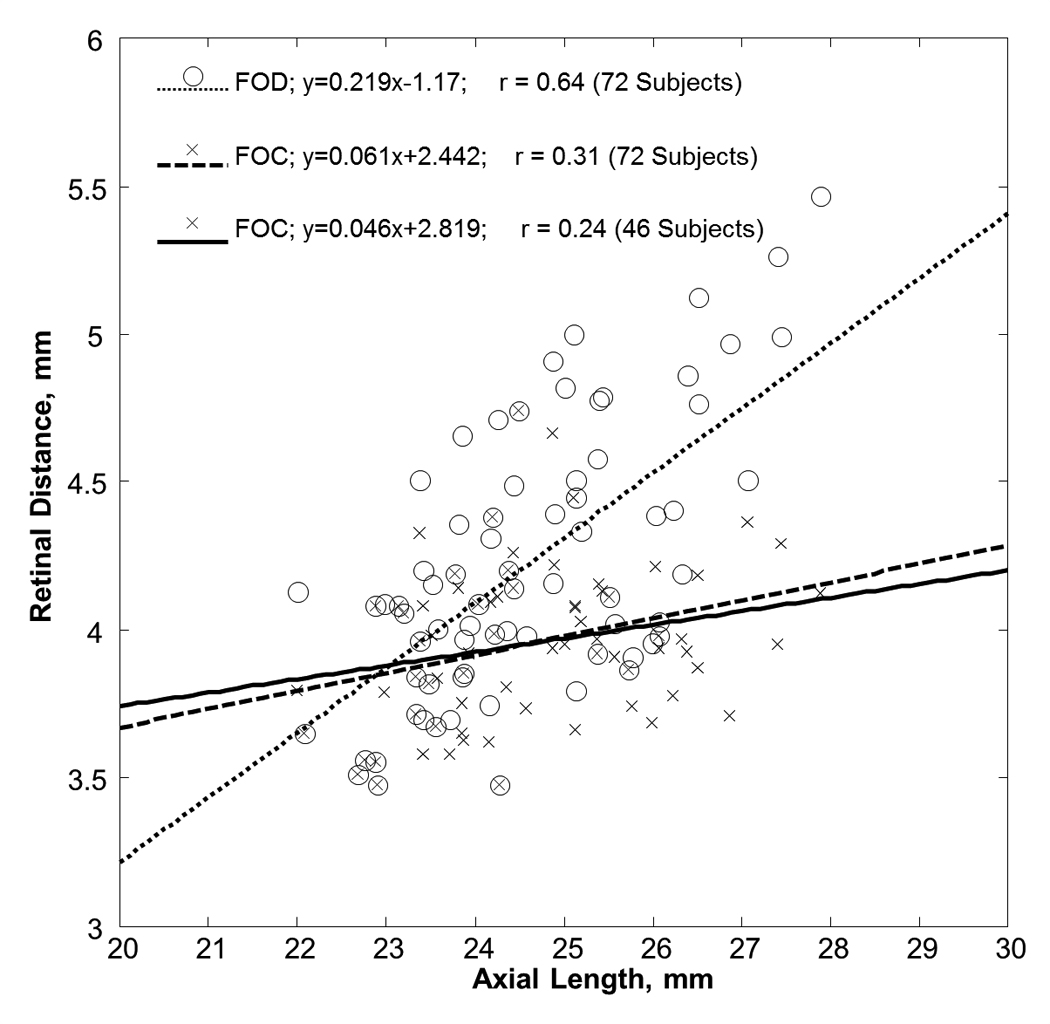
Figure 2.

Variation of retinal distance with axial length. Open symbols represent the retinal distance from the foveola to the temporal edge of the optic disc (FOD). Cross symbols represent the retinal distance from the foveola to the temporal edge of the crescent (FOC). The dotted and dashed lines represent the linear regression fit of the FOD and FOC in 72 subjects, respectively. The solid line represents the linear regression fit of the FOC in 46 subjects who had optic disc crescent.
