
Figure 1.
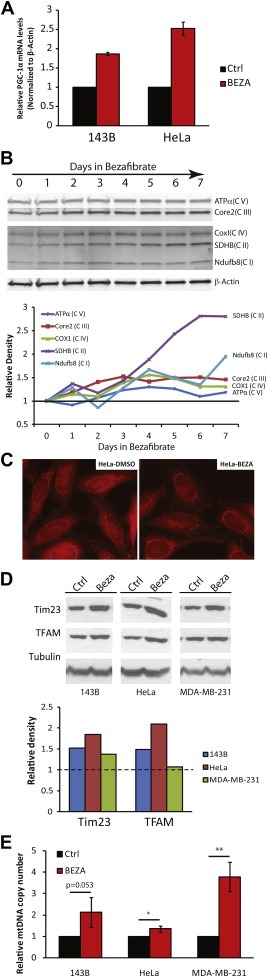
Bezafibrate induces PGC‐1α and OXPHOS components in cultured cells. A, Real‐time PCR determination of PGC‐1α transcript levels from cDNAs from 143B and HeLa cells. B, Western blot showing the steady‐state levels of OXPHOS components over a 7‐day treatment period of HeLa cells with bezafibrate (400 nM). C, Fluorescent microscopy of HeLa cells treated with 400 μM of bezafibrate of DMSO for 3 days and stained with MitoTracker Red for 20 min, showing the morphology and distribution of the mitochondrial network. D, Western blotting of total cell homogenate from 143B, HeLa and MDA‐MB‐231 cells, with antibodies against Tim23 and human‐TFAM, showing the increase of mitochondrial markers. Antibody against Tubulin was used as a loading control. E, Relative levels of mtDNA copy numbers in cancer cell lines. The expression of genomic gene β‐Actin was used as a reference (n = 3 and bars represent SD).