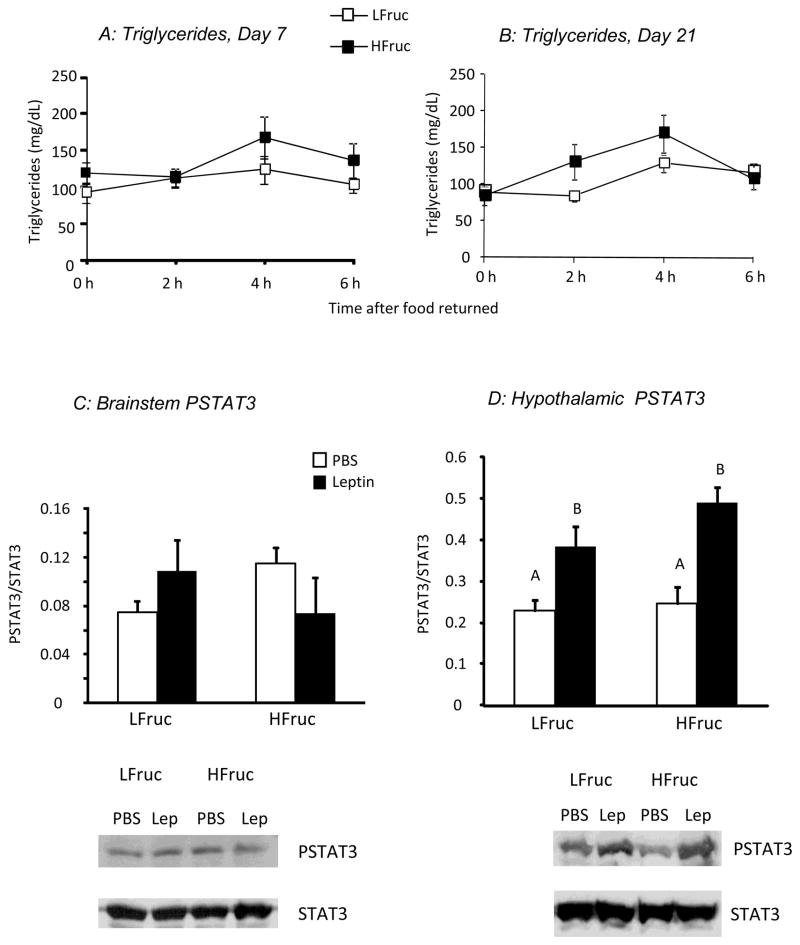
Figure 2.
Top panels show serum TG concentrations measured during the first half of the dark cycle in rats fed LFruc or HFruc diet for 7 (Panel A) or 21 days (Panel B) in Experiment 2. Bottom panels show the ratio of PSTAT3 to total STAT3 in brainstem (Panel C) or hypothalamic (Panel D) tissue collected from rats fed LFruc or HFruc diet for 26 days. Values for hypothalamic tissue that do not share a common superscript are significantly different at P<0.05.

