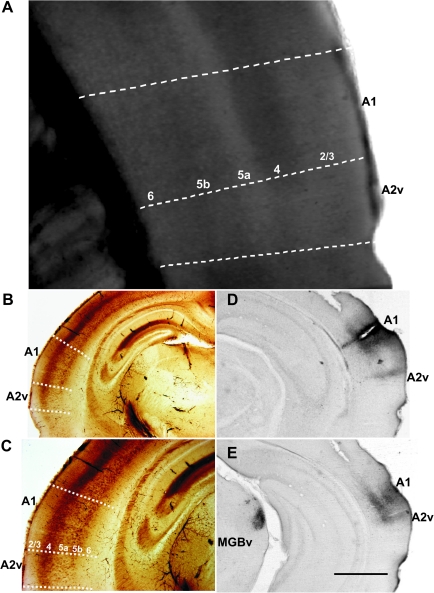
Figure 2.
(A) DIC image of living slice just prior to recording. Area A1 has increased cell packing densities as well as better-defined laminar organization compared with A2v. (B,C) Image of slice similar to that in A immunostained with a Group II mGluR antibody. (D,E) Example of a biocytin injection into A1, showing the site (D) and labeled terminal field in A2v (D,E). Labeling is also seen in the MGBv (E). The scale bar in E is 0.2 mm for A, 1 mm for B, D, and E, and 0.5 mm for C.

