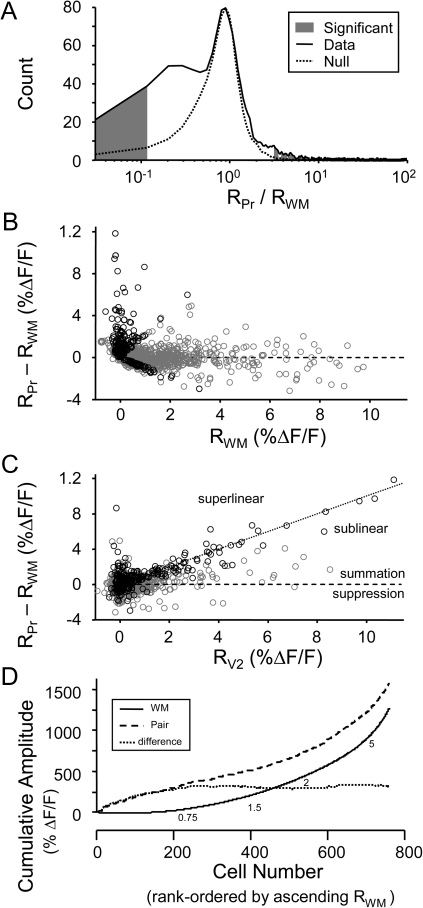
Figure 13.
Summary of effects of V2 stimulation on WM responses. (A) Statistical analysis of responses to determine cells whose WM responses were significantly affected by preceding V2L stimulus. The data distribution (solid line) consists of the ratio of mean paired to mean WM response amplitude in all cells with detected responses to WM, V2L, or paired stimulation (n = 1417 cells). Ratio values near unity arise from cells with no significant difference between paired and WM alone. Ratio values in the tails of the distribution arise from cells with significant differences. To distinguish between these 2 populations in the data distribution, a null distribution (dotted line) was created from the WM-alone responses and a local false discovery rate analysis was used to determine which values of the ratio were significantly different from unity (gray filled area). (B) Each point represents the difference between the responses to paired stimulation and WM alone (RPr − RWM) plotted versus the amplitude of the WM response (RWM) in a single cell. Zero difference indicates no effect of V2L stimulation. Values <0 indicate suppression of WM response by preceding V2L stimulation, while values >0 indicate summation, due to either enhancement of WM response (in the absence of response to V2L alone) or additive effects of V2L and WM responses. (C) RPr − RWM plotted versus the amplitude of the V2L response (RV2L) in the same cell, for the same population of cells as in (A). Values below the horizontal line (RPr − RWM = 0) indicate suppression and those above the line indicate summation. The identity line indicates linear summation. Values above the identity line indicate superlinear summation, while values below the line indicate sublinear summation. For panels (B) and (C), cells whose paired responses were significantly different from WM responses by the analysis of panel (A) are marked with “black circles.” All other cells are marked with “gray circles.” (D) Cumulative amplitude plots for the data in (B) and (C). All cells, both those whose WM responses were significantly affected by V2L stimulation and those that were not, are included. The increasing difference between the paired and WM curves at low WM response amplitude reflects the tendency of V2L stimulation to have the greatest effect on small-amplitude WM responses. Numbers below the WM curve indicate at what point in the distribution of cells the indicated WM response amplitude occurred. In all panels, only cells with responses of ΔF/F > 0.78 % to WM, V2L, and/or paired stimulation were included.

