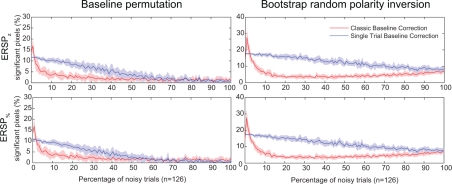
Figure 7.
Percentage of significant pixels in ERSP time–frequency decompositions of real EEG data with different percentages of noisy trials. Noisy trials are added to data trials of electrode Iz from subject “CLM” (see Materials and Methods). Two different statistical methods are tested: the baseline permutation method on the left column, and the bootstrap random polarity inversion method on the right column (see Materials and Methods). The first row represents data for time–frequency decompositions computed using z-score (ERSPz and ERSPFull TB − z). The second row represents data for time–frequency decompositions computed using percentage of baseline (ERSP% and ERSPFull TB − %). Classical ERSP baseline correction methods are represented in red and single-trial correction methods are represented in blue. Shaded areas represent SD which is estimated by adding noise to different random sets (n = 10) of trials. Single-trial correction methods always outperform classical baseline methods when the number of noisy trials increases.

