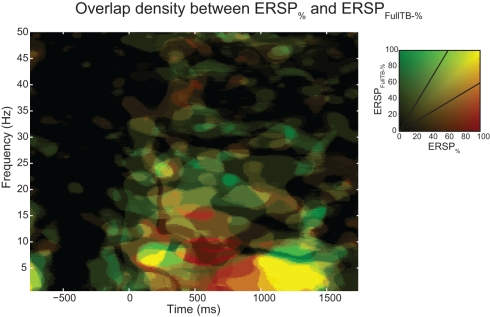
Figure 9.
Density of ERSP% and ERSPFull TB − % significant pixels across subjects and their overlap. ERSPs were computed for electrode Iz of 14 subjects and significant pixels were computed using the baseline permutation method (see Materials and Methods). ERSP “density” represents the percentage of significant subject at each time–frequency point from 0 to 100% (all 14 subjects). ERSP% density of significant pixels is represented in green, ERSPFull TB − % density in red, and the overlap between ERSP% and ERSPFull TB − % densities is shown in yellow. Density is coded by color saturation level, higher densities are shown with higher saturation level.

